Electric Market Trend 2023 And Beyond


We’ve just passed the time of year when analysts and market content creators release their year-end review and prognostications for the coming year in electricity. While we don’t want to add to the list of “year in review,” we will touch on some events that happened last year and point out a few things we think are relevant going into 2023. The real purpose of this writing will be to discuss the return of volatility in the electric markets and why we think it could be here for a while.
A reminder, our mission statement has always been to make comments as if speaking to those hedging and not speculating. In our view, hedgers should be more interested in building a solid plan that meet their needs and let day-to-day moves in the market present opportunities to exercise a well-constructed plan. A good plan includes identifying specific hedging strategies based on needs and taking advantage of markets to execute those strategies. For example, independent power producers will not have the same strategy as an end user creating widgets, or a municipality charged with keeping the lights on. While the strategy might be different for each, and there maybe be other commodity inputs to consider, each can use the markets to fix a purchase or sale at a predetermined price or time.
While all plans aren’t created equal, all need to work within markets. Operating in these markets became much more challenging last year as volatility reemerged in a substantial way. While swings in gas and electric markets have always been a hallmark, greater price swings and frequency emerged for various reasons. There has been plenty of discussions about how the invasion of Ukraine by Russia brought on the exaggerated moves in the markets, and we will return to some sort of normalcy this year. We think that in the long term, it might be a little more complicated than that.
It's worth pointing out that volatility can be viewed as bad or even scary, but we would argue it provides opportunity. In the last couple years, and already in 2023, both buyers and sellers have had opportunities to lock in favorable positions when considering price. If we understand volatility and risk, it can be built into hedging plans and mitigated.
Market Trends
As stated above, the war in Europe has received a lot of blame for some of the exaggerated moves seen in electric markets last year. While we concede the war had a major impact on electricity prices, we think it pulled forward some long-term trends that are going to add volatility, with the potential of exaggerated highs and lows in the future.
Admittedly, trying to identify just a few trends that have the potential to be the most disruptive to electric markets seems like it could be an exercise in futility, especially as we preach building hedging plans and letting the market take care of it, but trying to understand the marketplace and the factors that might drive price are worth contemplating. In this note, we introduce five trends we think are going to add uncertainty to electric pricing this year and beyond.
· Inadequate transmission.
· Intermittent generation.
· Baseload electricity with a just-in-time fuel source.
· The marginal fuel source becoming fungible on a world market.
· Increased speculative capital in fuel source commodities.
Inadequate Transmission
Each year, it seems transmission becomes more and more of an issue as baseload generation near population centers is retired and replaced with intermediate generation in far off, sparsely populated areas. The greatest evidence can be seen in MISO, ERCOT, and SPP, where wind has become a large renewable. Walk outside in southern Minnesota or the panhandle of Texas on a cold day with the wind blowing and you can almost bet the local price of electricity will be far below the population centers to the east or south. The heat map below, taken from the MISO Market Monitor-Potomac Economics, illustrates the congestion in the fall of 2021 and 2022. In MISO north, this isn’t just a fall event, this is an almost everyday occurrence as the map shows the bottle neck of wind generation trying to find a home. At issue here, the real-time price of electricity (LMP) might be in the single digits while the red and yellow areas could be $40-over $100/MWh. In many hours, parts of the blue have negative LMPs, meaning a generator is being charged money to put electricity onto the system.
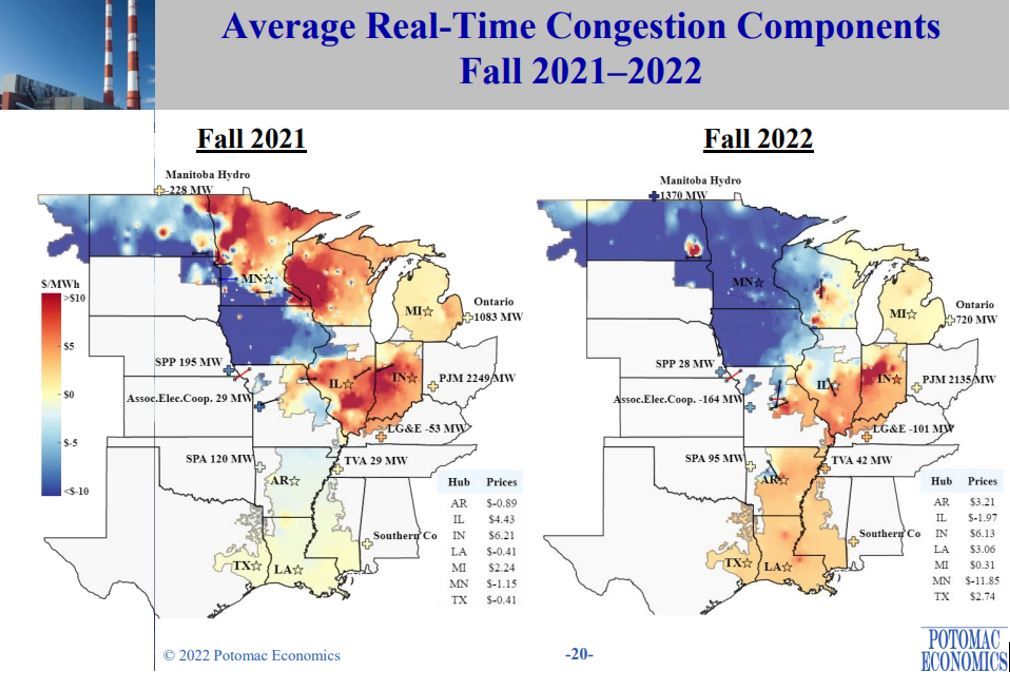
All the ISOs, FREC, and NERC acknowledge transmissions are a problem with solutions that aren’t simple. The heat map shows the issues of congestion in the transmission system which require more capacity. In addition to capacity, most of the transmission in this country was built fifty years ago and needs upgrades and safeguards. Upgrading and protecting existing infrastructure and outright building new capacity are going to compete for limited dollars. As one might expect, trying to construct a new transmission line is not easy nor quick. Studies must be completed, permits must be granted, land negotiations, activist interaction, and sourcing materials are all part of the process. Late last year, transmission and natural gas distribution were dealt a blow that will add to this process when Senator Manchin’s permitting reform act couldn’t be attached to another bill and was defeated. One bright spot last year was MISO approving 18 new projects costing around $10 billion. Some of these projects should alleviate the congestion issues represented by the heat maps. While this is indeed good news, MISO says some of the projects might be ready to come online by 2028, which isn’t tomorrow. The bottom line, maps like the above will continue throughout all the ISOs as generation comes online faster than transmission can handle it. These are hardly pictures of efficient markets.
Intermittent (Renewable) Generation
A disclaimer is probably warranted to start. We are in favor of renewable generation of all kinds and believe they have a place in the generation stack. We would appreciate it if the conversation was a little more nuanced. Those that argue for, or against renewables, come strong with all kinds of charts and studies to support their claims, some of which we subscribe to and some not… on both sides. One of the issues with renewables we addressed above with inadequate transmission is getting the electricity generated to the market. Again, building generation assets great distances from population centers requires transmission. Just to reiterate what we think is an especially crucial point, would we question Amazon if they built a distribution center somewhere in the Midwest like North or South Dakota to serve Chicago and Minneapolis using only a gravel road?

Intermittent renewables have begun to price some legacy baseload generation assets out of the market leading to retirement. As coal and older natural gas units are replaced by renewables, it creates a generation stack that is weighted on the extremes regarding pricing. On days when demand is light and renewables are in the market, prices are low. Conversely, on days when demand is high and renewables aren’t performing at their highest capacity, prices are higher as more expensive generation is needed. While not a scalable solution today, the hope is some of this might be mitigated as utility scale batteries come online in the future.
Perhaps a quick lesson on the pricing of daily wholesale electricity is warranted here. The ISOs that operate the grid in most of the country run on a daily auction for the following day's electricity needs for each hour. The ISO models its demand for the coming day and then ask generators to submit how many MW they are willing to generate at a price point. In a Dutch auction-like manner, the lowest priced generation is accepted first followed by units based on cost and volume to get to the point where generation equals forecasted demand. The unit of generation that meets the demand, and sets the "cleared" price, is called the marginal unit. That cleared price is paid to all the accepted generators regardless of their offer. For example, if for a certain hour the cleared price is $50/MW, all those accepted get $50/MW regardless of the generation asset type.
Renewables are for the most part price-takers, meaning they will offer their forecasted generation at the lowest price as they have no fuel cost, so they are generally first to be accepted. Most generation assets offer different cost points, creating a linear curve from low-cost units to highest cost. On days with light demand, prices are low as there are ample low-cost units to cover demand. As demand increases, so do prices as more expensive generation is added is added. With more inexpensive renewables having been added, they have replaced some of those assets in the middle of the curve. This is pushing the curve of generation assets to look less linear as higher priced assets such as peaking plants (those willing to run at higher prices) now fill out more of the generation shortfall. While this transformation to more renewables and cheaper natural gas has helped lower overall pricing, it can be argued it has created more fluctuations in pricing as demand rises or renewables aren't available.
Electric Generation's Just-in-Time Fuel Source
The next three points in our discussion will include natural gas. In the past decade and a half, natural gas has replaced coal as the baseload fuel in most of the United States. Add to that, it has also become the marginal fuel in all the ISOs. Revisiting our generation auction, the marginal fuel is the fuel source of the asset setting the price for electricity for that hour. In short, the price of natural gas has become very correlated with the price of electricity. Before the transformation of the grid to renewables started, it went through a similar move from coal to natural gas. Fracking has been a transformational invention allowing the United States to become the biggest producer of natural gas and oil in the world. This has allowed natural gas to be the largest fuel source of electrical generation. In fact, according to EIA, in 2021 natural gas accounted for 38.4% of electricity generation in the United States, with coal being a distant second at 21.9%. It has also been the chief reason for lower electricity prices in the United States over the past decade.
With the transition from coal to gas being made, so too has the form of delivery and storage. With a coal plant, there is almost always inventory stored on sight. Whether it is delivered by onsite mine, train, truck, or barge, coal is off-loaded and stored near the generating station. Natural gas plants typically don’t have onsite storage. With some exceptions, the majority of natural gas fired generation systems are subject to the just-in-time nature of pipelines.
The US natural gas pipeline network is made up of roughly 3 million miles of mainline and secondary lines delivering gas to customers. Electric generators must compete with other consumers, like households and manufacturing for pipeline space scheduled for certain trading points. For the most part, pipelines are able to deliver all the gas that is demanded. To do so, they conduct a similar exercise to electricity with day-ahead scheduling for space on the pipeline with a nomination of quantity for those demanding gas. For a variety of reasons (typically cold weather), sometimes there is more demand for gas on the pipeline than can be delivered. When this happens, those who can afford to reduce their load can sell at the delivery point in a spot market with prices being significant. Below is an example of constrained pipeline and pricing in the west this past December. This was a combination of some pipeline outages and increased demand because of the cold. Keep in mind when looking at this chart, Henry Hub natural gas trading on NYMEX averaged around $5.50 and traded just over $7 during Winter Storm Elliot.
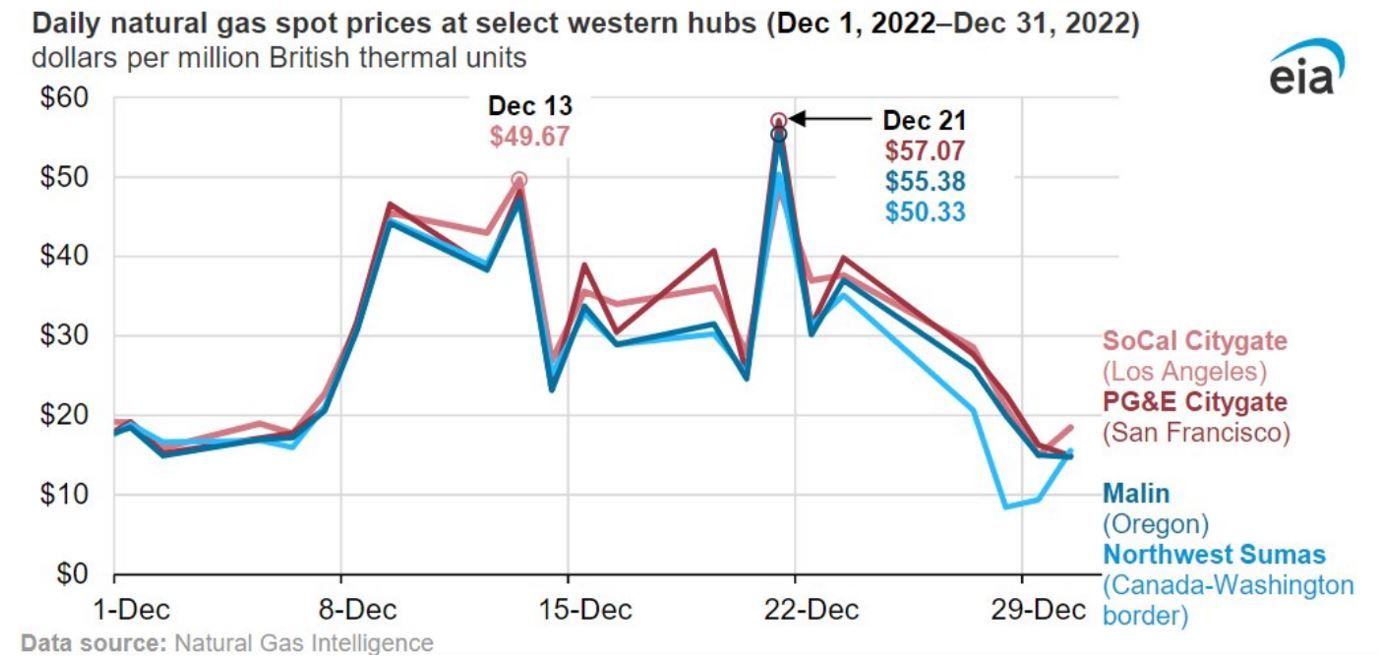
If we reference the ISO day-ahead generation price curve description, natural gas fired generation units almost always schedule their price to generate off the spot market with input fuel cost multiplied by what is known as a heat rate curve. Heat rate, for this discussion in simplest terms, is the amount of input fuel needed to generate one megawatt hour (MWh) of electricity. As an example, a fairly efficient gas turbine can turn seven to ten tradeable units (MMBtu) of natural gas into one MW of electricity. That would mean that $3 natural gas would equal $21-30/MWh electricity and $6 natural gas would $42-60/MWh. That means that on each of these days, the offer made into the day-ahead generation auction would be vastly different depending on natural gas prices. For clarity, we are simplifying this a bit as there are other costs that get added to the to the electricity offer, but in the case of natural gas units, fuel is the most variable. According to S&P Global, CAISO pricing for December averaged just under $300/MW for the month which was roughly 5.5 times the amount in 2021.
The Increased Fungible Pricing of Natural Gas
The advent of LNG technology is quickly making natural gas a fungible commodity like oil. Because the characteristics of oil are the pretty much the same around the world, and because of the supertanker, oil has a few worldwide benchmarks that trade very closely. While natural gas, like oil, has pretty much the same characteristics regardless of where it’s pulled from the ground, historically it hasn’t been able to be shipped, thus it traded in distinct local or regional markets worldwide. In the United States, natural gas has historically traded at a discount to most other countries in the world as shown in the chart below.
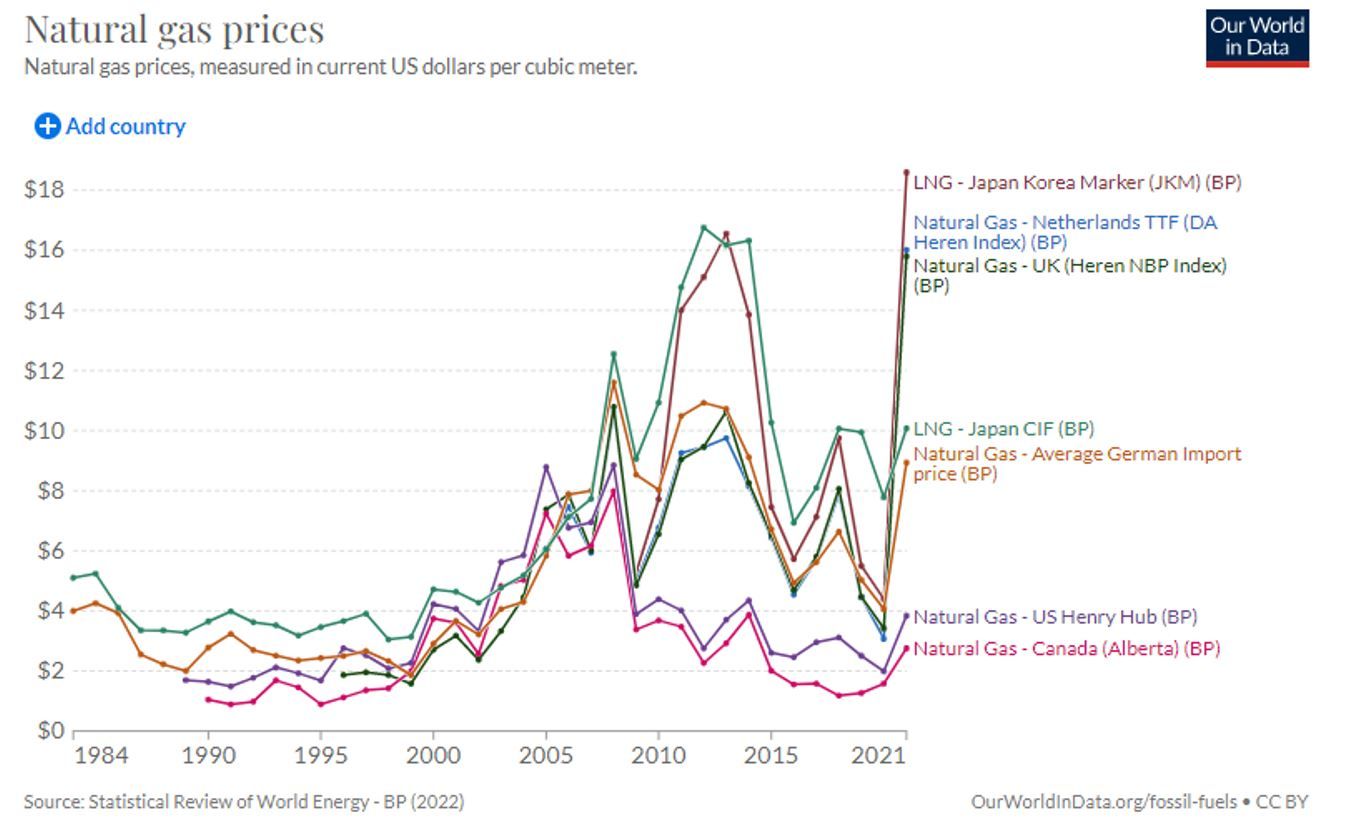
The ability to ship natural gas is changing rapidly around the world as LNG terminals are built and that could mean a more worldwide indexed commodity, like oil.
In 2022, the US finished second to Australia, just ahead of Qatar, as the largest LNG exporting countries in the world with an average of 10.6 billion cubic feet/day (Bcfd). Had a large export terminal in Texas (Freeport) not been damaged by fire and offline for half the year, the US would have easily achieved the title of top LNG exporter in the world.
As shown below, the United States is in the process of expanding its LNG export capacity. In just three years, it is forecasted that the capacity will rise roughly 50%.
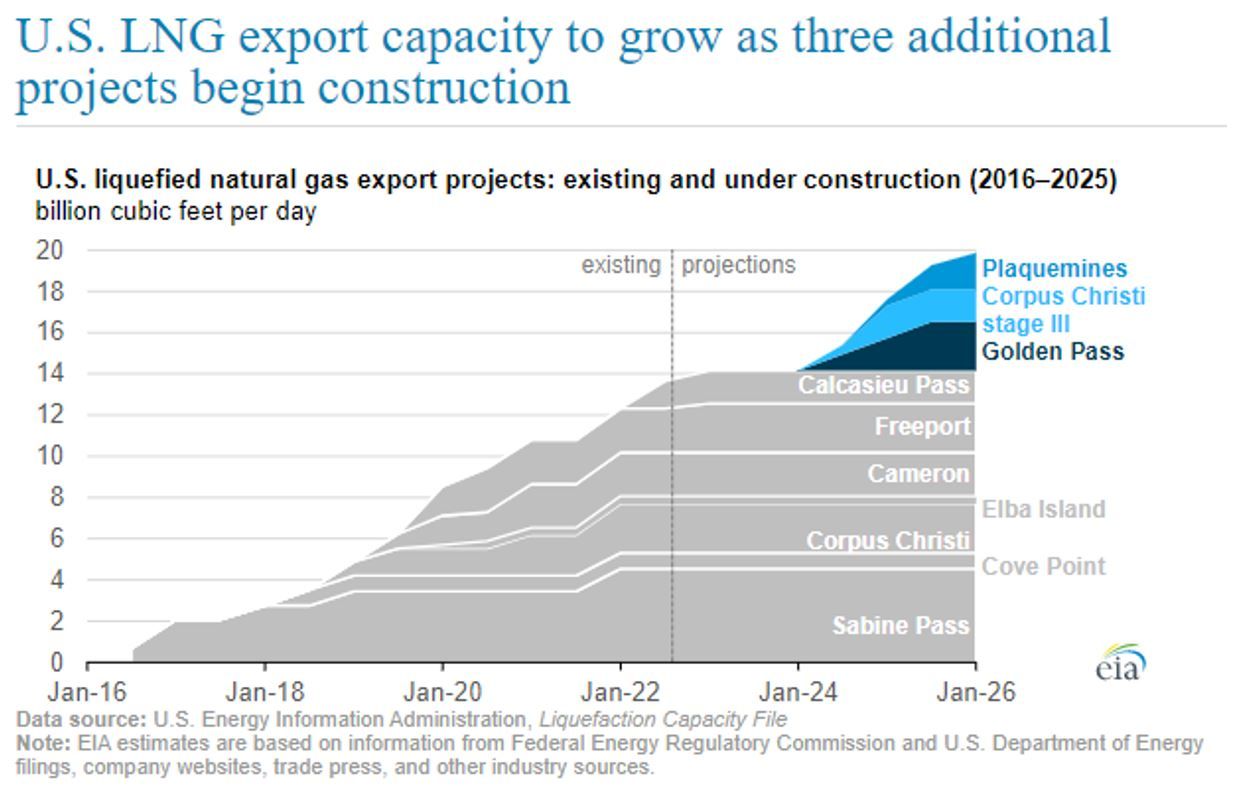
As the United States builds out its ability to export, more and more US domestic natural gas production could find its way to the world market which could cause domestic prices to rise. The Russian invasion of Ukraine provided some insight (albeit probably exaggerated) on what this might look like. In June, as Europe scrambled to secure natural gas for the winter after cutting off Russia, Henry Hub pricing traded up to $9/MMBtu as the world market prices moved higher. In July, Henry Hub retreated 40% from June levels as the fire at Freeport disabled some of the US export capacity. Had the US had available export capacity and available LNG tankers, more gas would have been bound for export and domestic prices would have stayed elevated.
While it could be argued the world gas price spike in reaction to the Russian invasion is a one-off event, the actions taken will have some lasting effects. Russia’s natural gas will probably find a market, but with sanctions in place, it probably won’t be Europe which could mean LNG will continue to be a big factor on the world market.
Not to be outdone by Europe, we have an example in the United States of a market that is affected by both the LNG world market and constrained natural gas pipeline… the New England ISO.
Source: ISO New England
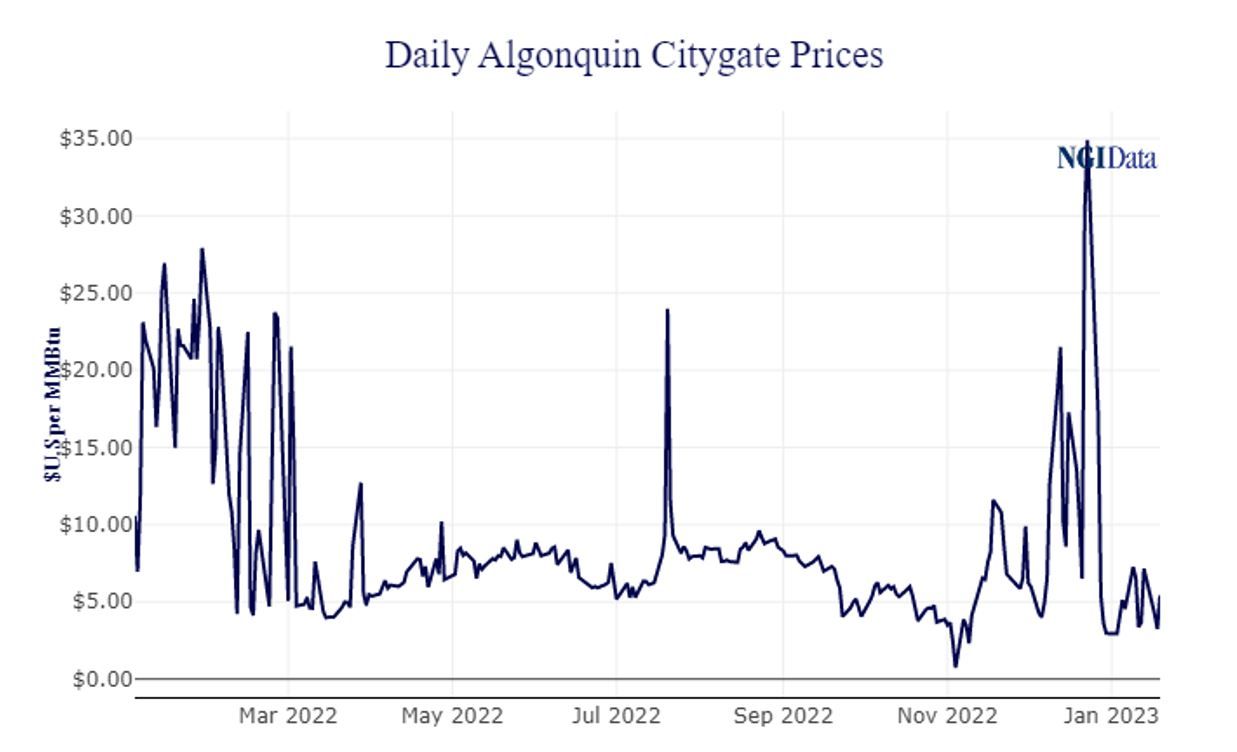
Some might claim the above statement to be hyperbole, but it’s a quote from ISO New England’s own website. ISO-NE generates roughly 53% of its electricity from natural gas. At issue, only six interstate pipelines serve ISO-NE, priced at the Algonquin Citygate trading point. These pipelines can’t always meet the natural gas demands of the northeast. To supplement its gas demand, ISO-NE is the only place in the United States that imports LNG, with the majority coming to Exelon’s Everett terminal in the Boston harbor. To make matters more complicated, US shipping is subject to the 1920’s Jones Act that states any ship not built in the US, with US materials, and crewed by US citizens shall not be allowed to transport certain goods from US port to US port. Because there are exactly zero LNG tankers that fit the criteria, shipping LNG from the ports of Louisiana or Texas is a no-go. That means ISO-NE LNG prices are inline, or higher than the world LNG market as gas has to come from foreign markets. According to the Department of Energy and Natural Gas Intel (NGI), Everett and another terminal imported 22.4 Bcf between December 2021 and November 2022 at an average price of $27.51/MMBtu. Over that same period in 2020 and 2021, those terminals took in 25.3 Bcf with an average price of $9.16/MMBtu. Add an average of $27.51 to supplement to the prices in the chart below, and one can see the issue for New England.
The circumstances of the New England ISO make it a unique case regarding the price and availability of natural gas. That said, as demonstrated by California this winter, gas interruption or constraints seems to be increasing across all ISOs.
Increased Speculation in Natural Gas
In late November of 2018, a now infamous YouTube video surfaced of a hedge fund manager all dressed in an expensive suit sitting at desk explaining, with some tears, how his fund had been hit by a “rogue wave” that “likely cost me my hedge fund.” That “rogue wave” was caused by some unseasonable but not unprecedented cold, setting off a mass short covering in the natural gas markets. Below is a CNBC headline from November 19, 2018.
"Wild trading in natural gas futures drove prices up 18 percent Wednesday to a four-year high on record volume, as the latest cold weather reports spooked a market worried by low supply."
Source: CNBC
While the market was somewhat concerned about supply, it had also swelled with speculative trades. The trade de jure had become a pairs trade of buying oil and shorting natural gas. A pairs trade is where someone might buy one commodity and sell another short if you deem the spread between the two excessive. The expectation is the spread will converge and you liquidate the trade for a profit. While large losses in natural gas aren’t unprecedented (see Amaranth Advisors, LLC in 2006), the number of different entities in the marketplace making speculative trades has continued to increase. 2018 was a case of too many speculators in the same trade and it set off a margin event where short sellers of natural gas were forced to buy their positions back to satisfy margin calls. The higher the price, the more margin calls. This buying set off a three-week rally that saw natural gas spike roughly 50% before retracing in 25% January. Unfortunately, there were many end users of natural gas and electricity that suffered the price spikes as well.
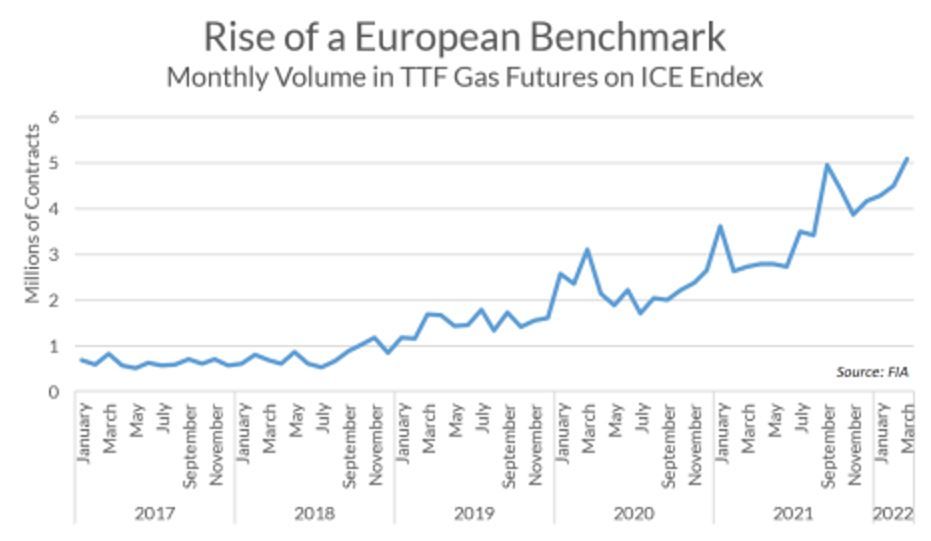
Commodity markets were initially set up so buyers and sellers could fix price-hedging. Most of our comments are made with hedgers in mind, but there is an appreciation for speculators as they do provide liquidity to markets. Commodity markets, unlike equity markets, are not subject to a finite number of shares to trade. If someone wanted to buy a share of Microsoft, they would have to find a seller and are limited to the shares outstanding. In the world of commodities, there are no limitations on contracts. A buyer and seller can simply come together and create a contract traded and cleared on the exchange. Since the great recession of 2008, central banks around the world have been printing money through programs like quantitative easing. In addition, trillions of more dollars were created in the last couple years to help deal with the economic side effects of the Covid pandemic. More and more money in the system leads to more speculation across all risk assets, including commodities such as natural gas, creating the potential for more 2018 scenarios. If that isn’t enough, add a European invasion to help with future trading volumes. A chart of the TTF futures contract, which is the main benchmark for European gas, listed on the ICE Endex exchange in Amsterdam shows the rise in contracts traded over the last five years.
We concede the excess speculative trading in natural gas, as it relates to volatility, usually results in some short-term rallies or selloffs often followed by some reversion to the trend. That said, market speculation, along with worldwide fungible prices and the just-in-time nature of pipelines in the United States, are perfect ingredients for a more volatile gas market.
It is also worth noting, increased speculation doesn’t always mean increased prices. We need to look no further than the oil market during the initial months of the Covid pandemic. In April 2022, the May contract for oil settled around minus $37. Basically, if you held a contract for physical delivery, you paid someone $37 to take your oil as there was no storage available.
2023 and Beyond
While not exactly starting out as such, in our view, 2023 has the possibility to look somewhat like 2022. The Russian invasion, subsequent sanctions, and gas cut off to Europe, set off a panic as gas supply and winter storage levels were suddenly in question. A sort of Berlin airlift reaction with LNG and an unseasonable warm winter have helped keep the heat, and lights, on in Europe. While both Europe and the US may come out of the winter with more gas in storage than last year, there is still a war being fought in Europe and supply is not guaranteed. In the interim, Europe (particularly Germany) has done a good job of substituting coal to ease the need for natural gas, but if manufacturing ramps, there could again be the same demand scenario heading into the summer and fall. If that happens, LNG will be called upon again and this time, the US should have the capacity to export which could drive prices higher.
With the possibility of 2023 including some of the same issues as 2022, the United States is the biggest producer of natural gas in the world. If production continues to ramp, there is more than enough natural gas to supply the domestic market if conditions normalize. The futures market in February is certainly telling us the market is leaning toward a much more subdued year with a possible return to 2021 markets.
If that reads like we are hedging our bets, it’s because we are. We think the short- and long-term marketplace for natural gas and electricity will provide ample opportunities for both buyers and sellers. As stated earlier, the last two years have given participants plenty of chances to put hedge trades in place. The March natural gas NYMEX contract is trading near $2.20 while eight weeks ago, it traded near $8. During the same time, PJM western 12 month on-peak electricity strip has traded from $84 to $55. The end of 2022 into 2023 moves in electricity and natural gas we've seen might be extreme, but they are certainly not unprecedented.
We have introduced some talking points we think are going to add to electricity price volatility going forward. With renewables, transmission and the natural gas complex all playing key roles, we expect electricity prices to be subjected to more exaggerated moves to the upside and downside. Trying to predict the timing and magnitude of those moves in a marketplace is a speculators game. Again, one last time, hedging plans are built to take advantage of market moves, not predict them. There's a saying attributed to Mike Tyson that has entered the lexicon of those discussing volatile markets, 'everyone has a plan until they get punched in the face.' We think climbing into the ring with Mike Tyson and not considering the possibility of getting punched in the face is a bad plan. Plan accordingly.