Weekly Power Outlet US - 2024 - Week 14
Electric Futures, Nat gas, MISO Eclipse


Electric Futures, Nat gas, MISO Eclipse
Energy Market Update Week 14, brought to you by Acumen.
For More Updates Like This, Subscribe Here!
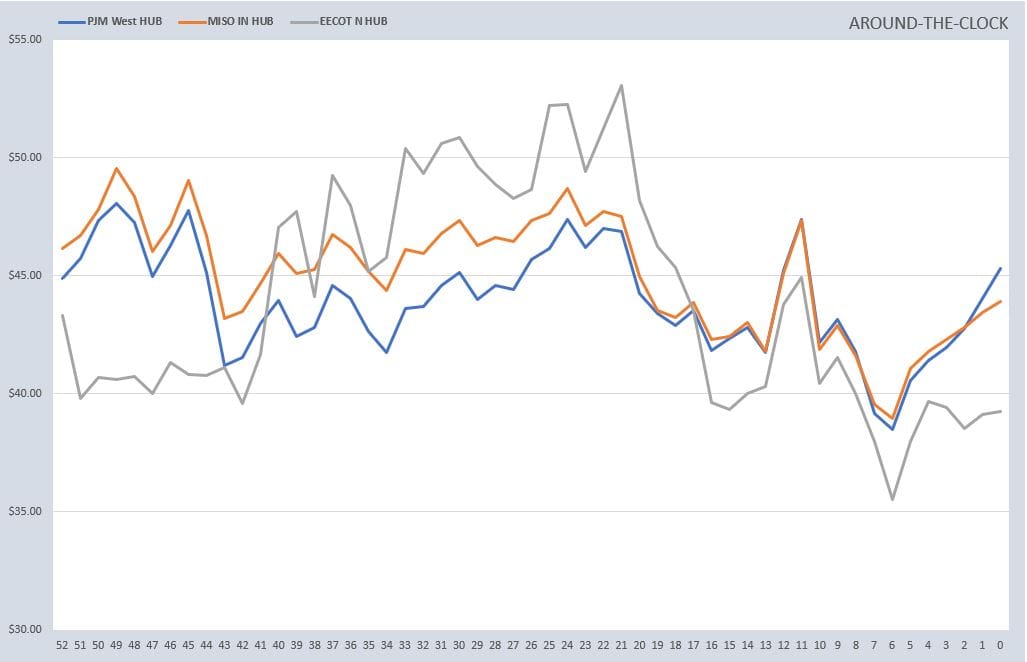
The electricity forward and futures markets continue to show an uptrend since bottoming just over a month ago. Looking at the charts of the ATC futures of PJM West and IN Hub, a technical chart reader might observe that each has reached an interesting 50% retracement on the trailing yearly chart. For now, this level probably is seen as resistance to further movements higher, but in up markets, yesterday's resistance can be tomorrow's support pretty quickly if the rally continues.
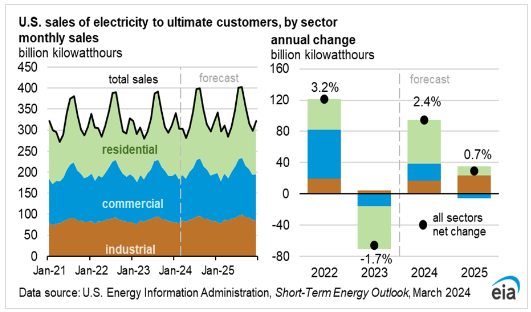
While the rally in futures doesn't feel dramatic, it has been somewhat impressive given that natural gas trades like it's as abundant as sea water. As we know, natural gas is the number one catalyst driving the electricity market, so why the slight divergence? It could be the sentiment on demand, especially given where electricity had been trading. While we are a touch late on this, EIA revised some of their estimates on electricity demand for 2024. As seen below, they forecast is for a 2.4% increase year over year after a YoY decline in 2023. Reading their breakdown, they expect a warmer summer which will push demand higher, especially in residential where they call for a 4% increase.
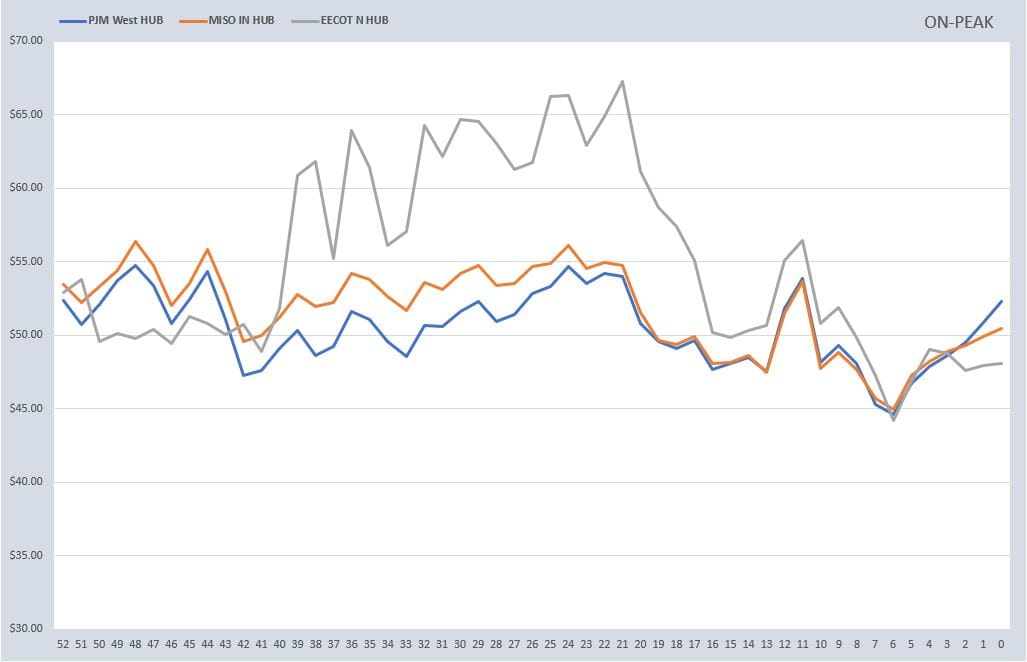
As would be expected, winter and summer months on the futures curve for electricity always have the highest premiums built in as load demand can vary drastically. Currently, summer months on the electric strip look pretty elevated given the natural gas curve and might help explain some of the divergence. As they say, we shall see.
Speaking of natural gas, both the US and Europe are about to exit the storage withdrawal season. Yesterday the EIA reported a withdrawal of 37 Bcf vs the estimates of 39 Bcf. Frankly the market doesn't even seem to care at this point as the US numbers are still roughly 40% of the five-year average. As impressive as that is, Europe is exiting winter with storage well over 100% higher than back in 2022 when the low storage and the Russian cut off incited the natural gas panic/rally abroad and at home as LNG was rushed to Europe.
Circling back to electricity, at this point, it's fair to assume the electric market will take its cues from the demand picture while always keeping a mindful pulse on natural gas. Obviously, the day-to-day market will be weather dependent, but the longer-term fundamentals with gas seem to be muted so overall demand is the story....for now.

Monday, starting from Southwest Texas and moving through the Midwest into Canada near Toronto, the US will experience another solar eclipse. Just a few years ago these would have been nonevents to ISO operators, but that has obviously changed with solar generation. While the eclipse will cut across Texas, ERCOT has said very little about it. MISO put out a note yesterday saying in preparation, they are increasing regulation requirements by 600 MW and short-term reserves by 1200 MW during the eclipse hours which should be a couple hours mid-day.
As part of a public service announcement, we will say this...if you Bonnie Tyler to watch "turn around, bright eyes", make sure you wear proper glasses.
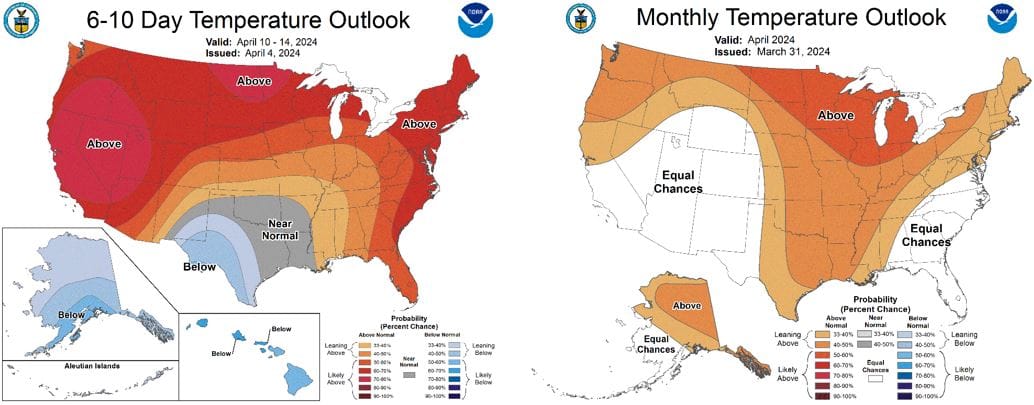
NOAA WEATHER FORECAST
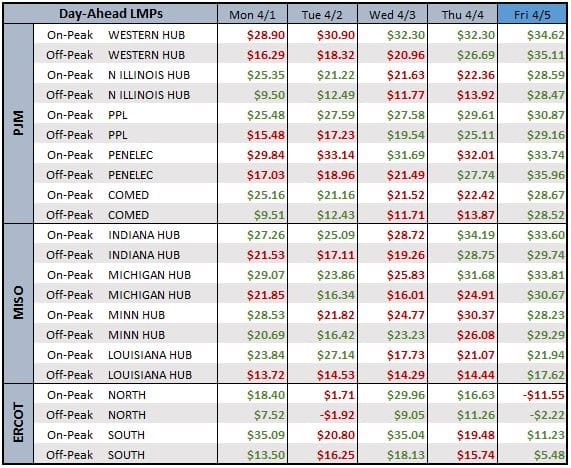
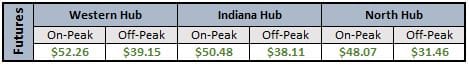
DAY-AHEAD LMP PRICING & SELECT FUTURES
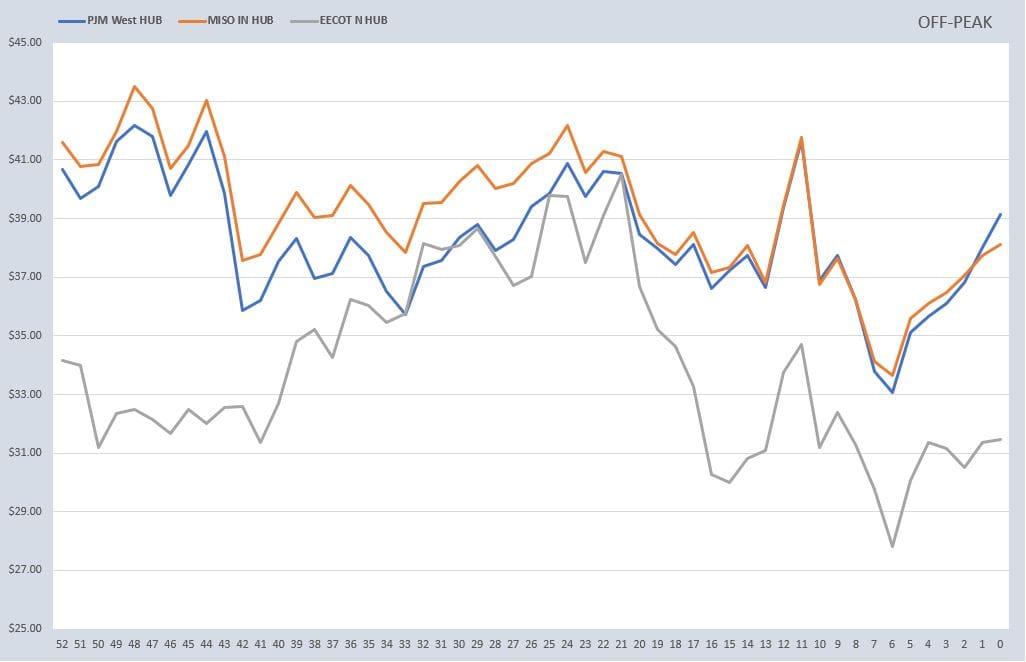
RTO ATC, PEAK, & OFF-PEAK CALENDAR STRIP
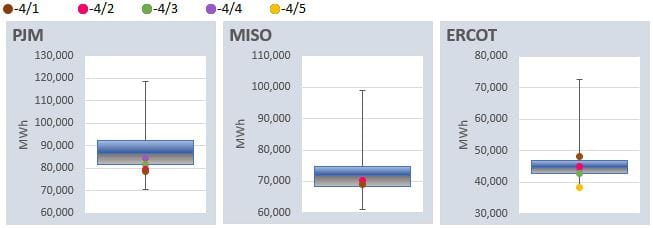
DAILY RTO LOAD PROFILES
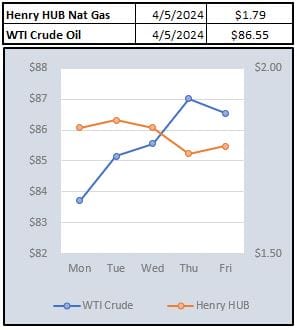
COMMODITIES PRICING
Not getting these updates delivered weekly into your inbox? Let's fix that, click the link below: