Weekly Power Outlet US - 2024 - Week 15
Nat Gas Inventory, EIA STEO, ISO Interconnection Que


Nat Gas Inventory, EIA STEO, ISO Interconnection Que
Energy Market Update Week 15, brought to you by Acumen.
For More Updates Like This, Subscribe Here!
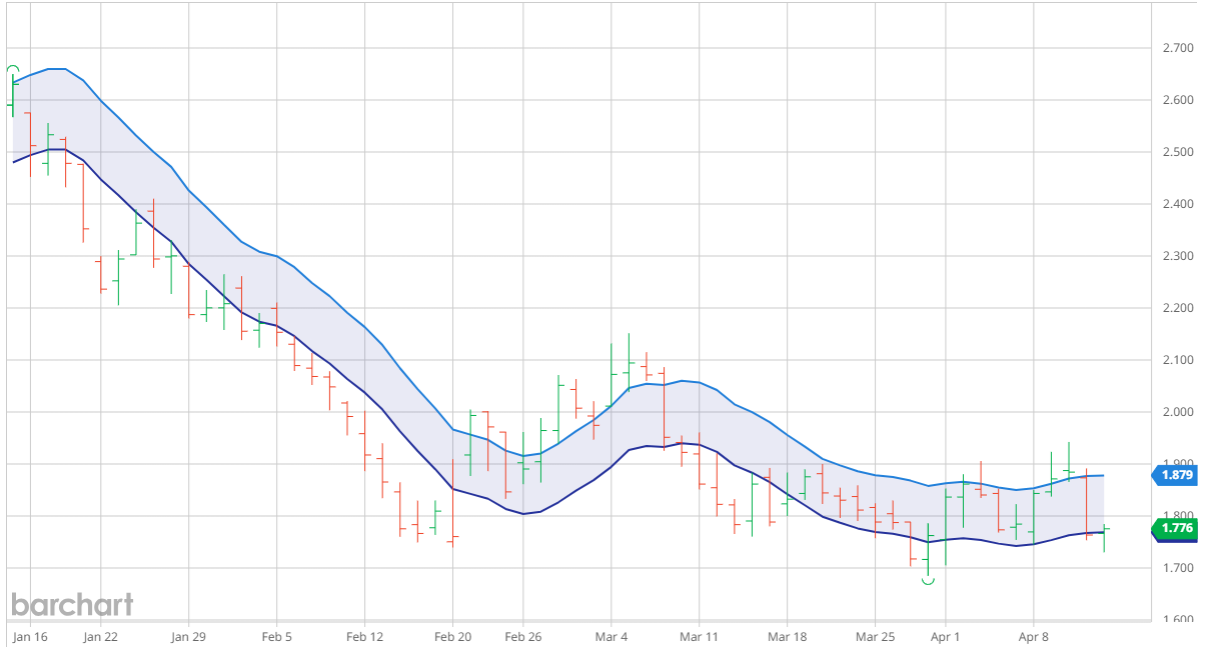
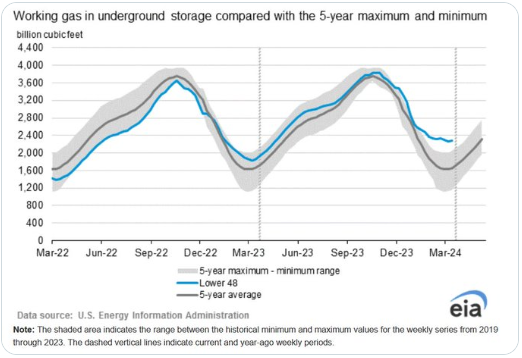
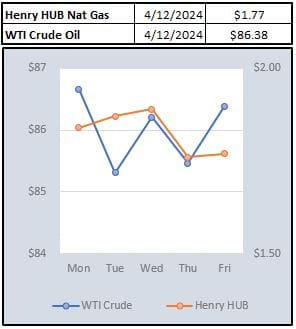
EIA storage numbers seem to matter less and less each week as the market realizes there is more than an abundant amount in storage heading into the build, or injection season. That said, this week the storage numbers showed an injection of 24 Bcf which now puts storage at 39% above the 5-year average (visual below). As the chart below shows, the natural gas market was starting to get a little steam under it as talk of production cuts and LNG capacity increases taking hold. Thursday's number has pulled the rug out from under the May contract as pricing has gone from a breakout to the upside of a moving average band, to testing the downside. While the market had showed some life over the last week and a half, spot gas trading negative in TX and the Southwest didn't leave much room for any kind of bearish news to be absorbed and that's exactly what the Thursday announcement was.
This week EIA also released the April version of the Short-Term Energy Outlook. Reading the statement below, EIA expects less production over the summer which will lead to less injection. Even if that's the case, they don't see the pullback in production to be enough to offset the record storage heading into the fall and are cutting pricing forecasts for 2Q24 to below $2 and to an average of $2.20/MMBtu for the full year.
Ironically, the Wall Steet Journal weighed in on this and provided some Wall Street numbers for context. UBS has cut their full year number from $3 to $2.54 for 2024. In all markets, expectations matter. While fundamentals are going to drive natural gas, having estimates and expectations reigned in, should be constructive to the gas market once things turn.
- Natural gas inventories. The U.S. winter natural gas withdrawal season ended with 39% more natural gas in storage compared with the five-year average. From April through October this year, we forecast less natural gas will be injected into storage than is typical, largely because we expect the United States will produce less natural gas on average in 2Q24 and 3Q24 compared with 1Q24. Despite lower production, we still expect the United States will have the most natural gas in storage on record when the winter withdrawal season begins in November. As a result of high inventories, we expect the Henry Hub spot price to average less than $2.00 per million British thermal units (MMBtu) in 2Q24 before increasing slightly in 3Q24. Our forecast for all of 2024 averages about $2.20/MMBtu. - EIA STEO April 2024
Electricity futures prices mirrored some of the gas market action this week. Electricity had been breaking from gas and been trending up over the last couple months. As pointed out last week, these moves could be more technical as some retracement levels had been reached, but it'll be worth monitoring to see if the gas/electric correlation returns.

As noted in a Utility Dive story today, grid energy connection queues added 27% of generation projects in 2023, led by storage and solar. Citing the Department of Energy's Lawrence Berkeley National Lab, at the end of last year, 2.6 TW of projects is looking to connect to the grids around the country. An astonishing part of the number is solar, battery, and wind make up 95% of that capacity. Another interesting part of the story is that only 14% of the capacity in interconnection queues from 2000 to 2018 has been built.
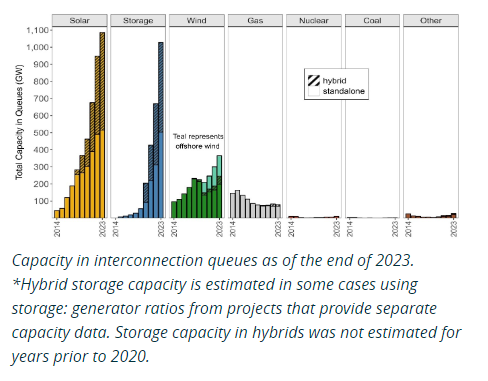
We've touch on, PJM specifically, how RTO/ISOs are having to reconsider rules to help alleviate some of the speculation, or holding a spot in line if you will. At this point, 12% of the 2.6 TW have interconnection agreements in place which usually suggests a notice to proceed.
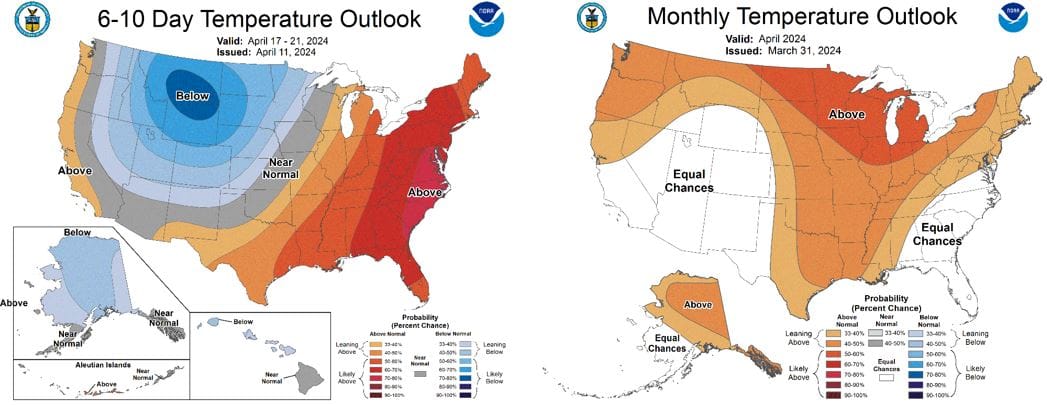
NOAA WEATHER FORECAST
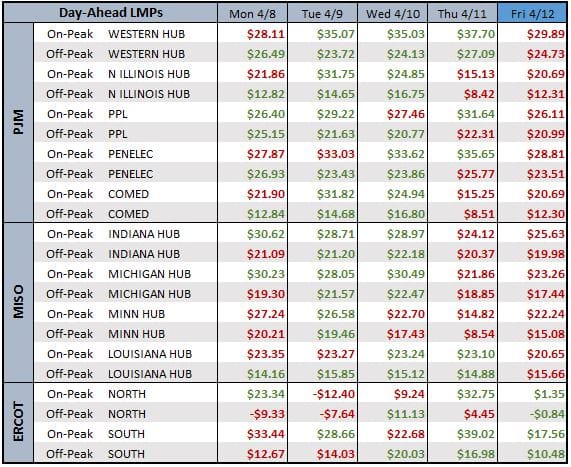
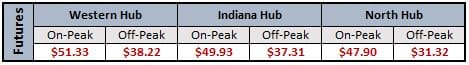
DAY-AHEAD LMP PRICING & SELECT FUTURES
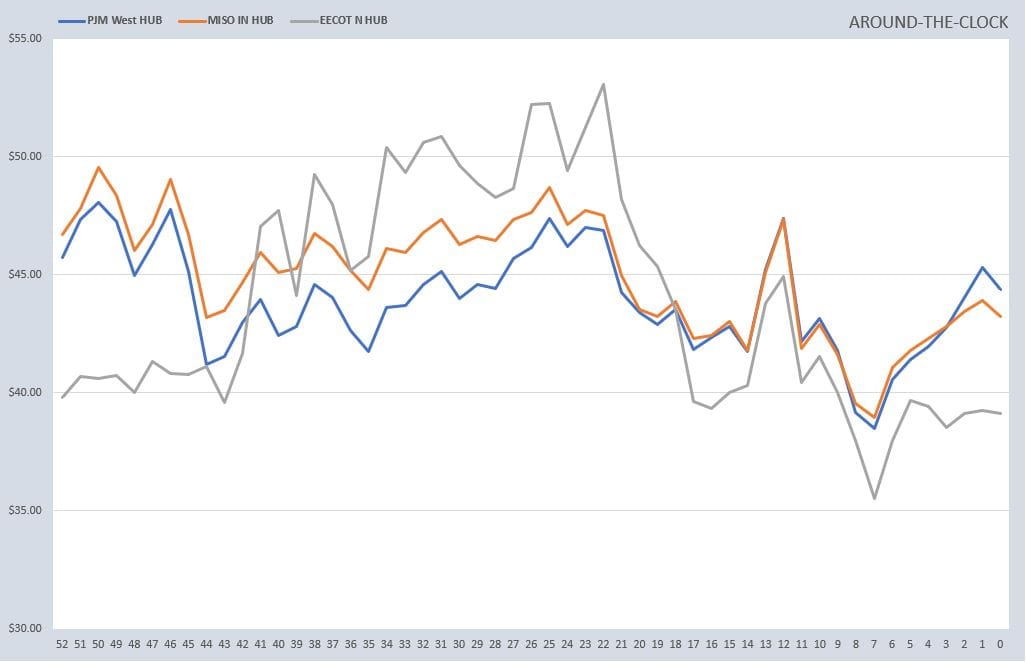
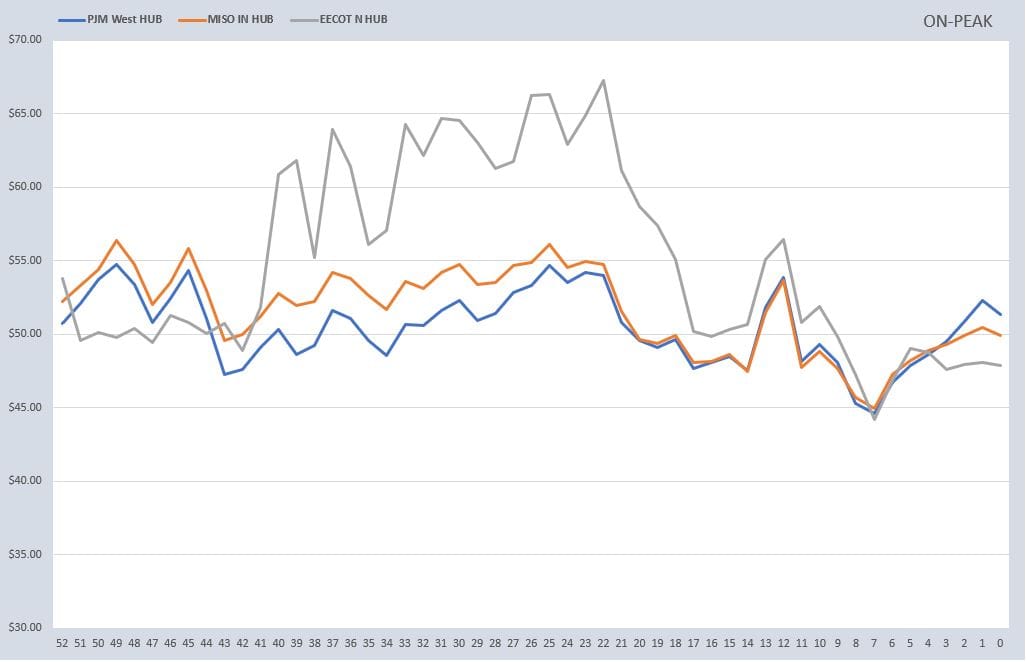
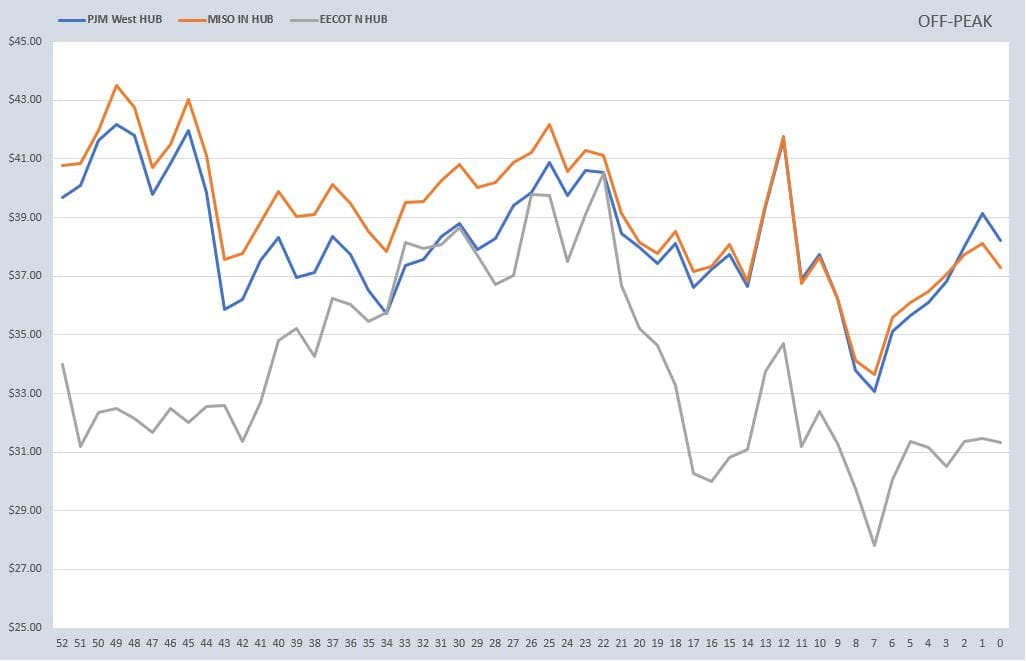
RTO ATC, PEAK, & OFF-PEAK CALENDAR STRIP
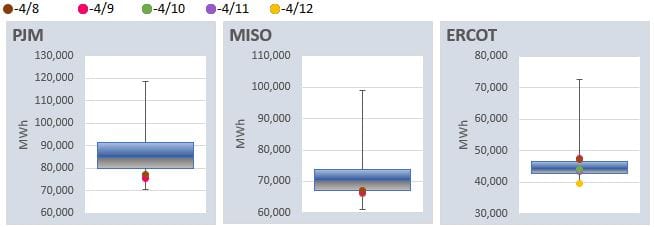
DAILY RTO LOAD PROFILES
COMMODITIES PRICING
Not getting these updates delivered weekly into your inbox? Let's fix that, click the link below: