Weekly Power Outlet US - 2024 - Week 20
FERC Order 1920, Solar Flares


FERC Order 1920, Solar Flares
Energy Market Update Week 20, brought to you by Acumen.
For More Updates Like This, Subscribe Here!
One of the ongoing themes we've had over the years has been the transmission system of the grid. In fact, in our final WPO edition of 2023, we predicted without predicting because we don't make predictions...that 2024 would be the year of the transmission discussion. In our view, this wasn't going out on a limb, because it just had to happen.
This week, FERC had a fairly major ruling by passing order no. 1920 with a 2-1 vote. In the words of FERC, this is the first time the Commission has ever squarely addressed the need for long-term transmission planning. FERC released a facts page that gives a good overview of the highlights.
As FERC stated, this ruling reflects tens of thousands of pages of comments, filed over the course of the past three years, from hundreds of stakeholders representing all sectors of the electric power industry, advocacy groups and state and other government entities. As could be expected, the reception was less than unified from those tens of thousands. Transmission owners were quick to point out that consumers will be burdened by costs of projects which was one of the big themes of Commissioner Christie's dissent. For the most part, renewable generation owners praised the ruling as it will speed and open possible transmission from projects to markets.
One pundit summed it up pretty well when stating something like, 'FERC voting to approve is one thing, making it happen is another.'.

Last week we kicked off the WPO with some commentary about solar flares and the geomagnetic alerts that had been issued by the ISOs. Of course, we couldn't just leave it at that, we had to go down a rabbit hole. Actually, it was the latest solar flare that got us going.
Earlier this week a solar flare measuring X-8.7 was released and in the words of NOAA's Space Weather Prediction Center, "Due to its location, any CME associated with this flare will likely NOT have any geomagnetic impacts on Earth". For context, the solar flares over the weekend measured in the X-5 area. For those not in the know, solar flares are measured by letter, with X being the most severe, and on a scale from 1-10. Fair disclosure, until a recent pour of bourbon and an hour read, we didn't know anything about the solar flare scale either.
Now that we've established some sort of measurements, X-8.7 had the ability to be a nasty one and there are some who are much more versed in this saying we kind of dodged a bullet on this one. That got us thinking, what exactly is the issue. Basically, we kind of understand that geomagnetic currents get introduced into the grid and can fry equipment. Looking beyond that, we found a paper done by NOAA a few years ago that does a pretty good job of describing what, why, and how of it all. Again, under fair disclosure, bourbon or your favorite drink might help.
Ok, now that we have that covered, did you know that depending on the rock formations you, or your equipment, lives near could determine the severity of the solar flares? Like I said, rabbit hole. Apparently less porous rocks are able to hold water and help conduct electricity, while metamorphic rocks like granite are electricity resistive meaning the grid takes the hit. If interested, here is actually a detailed paper on the subject. Our final fair disclosure, there is real math so we skimmed.
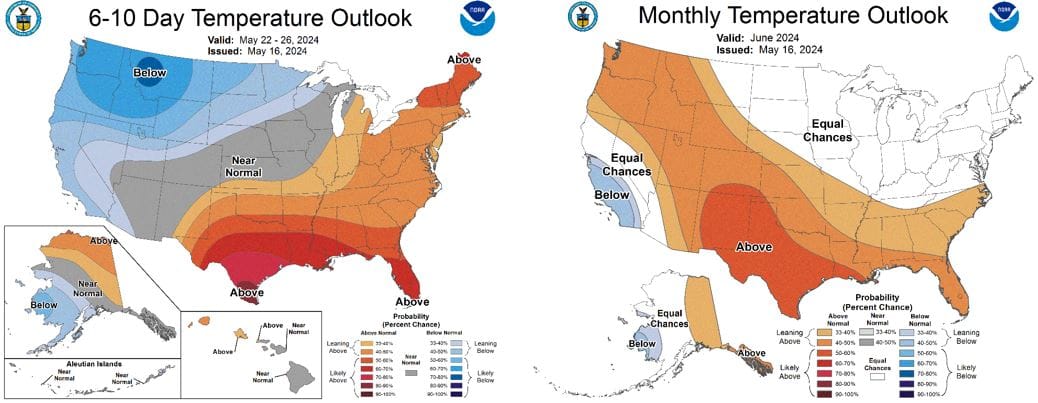
NOAA WEATHER FORECAST
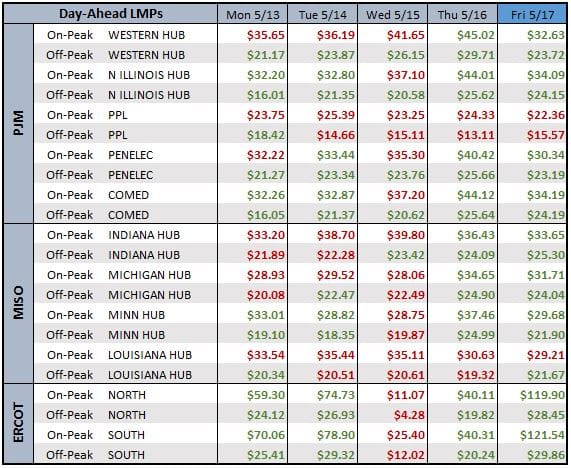
DAY-AHEAD LMP PRICING & SELECT FUTURES

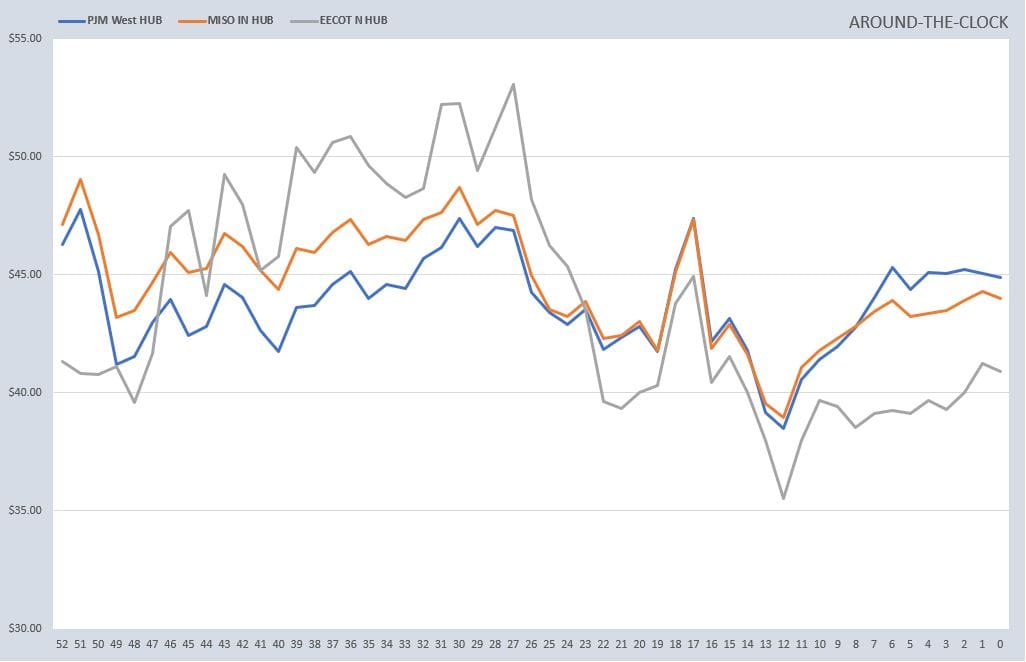
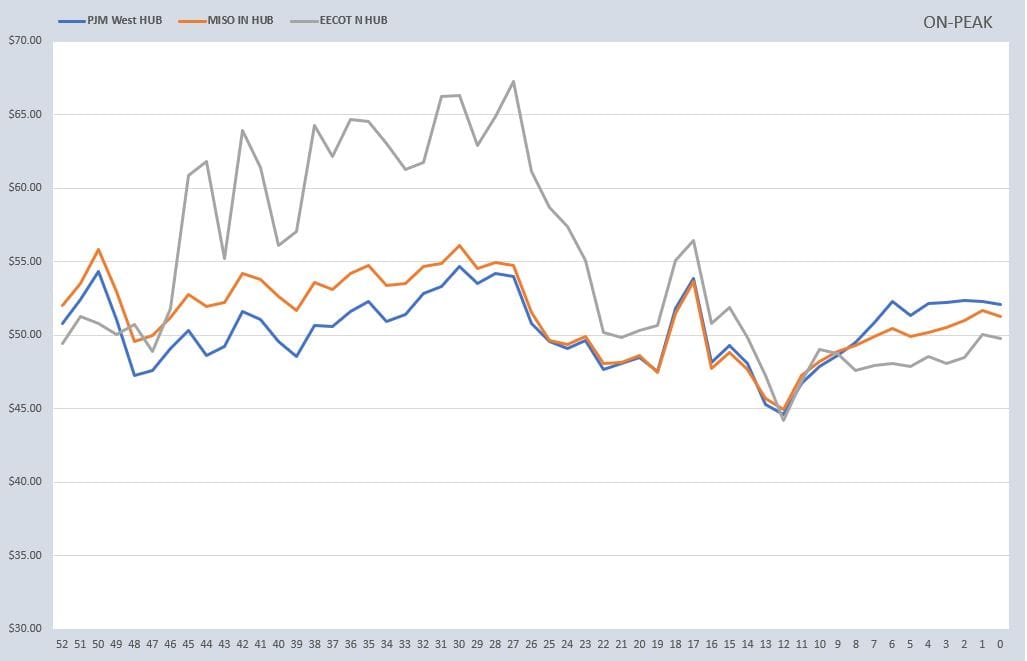
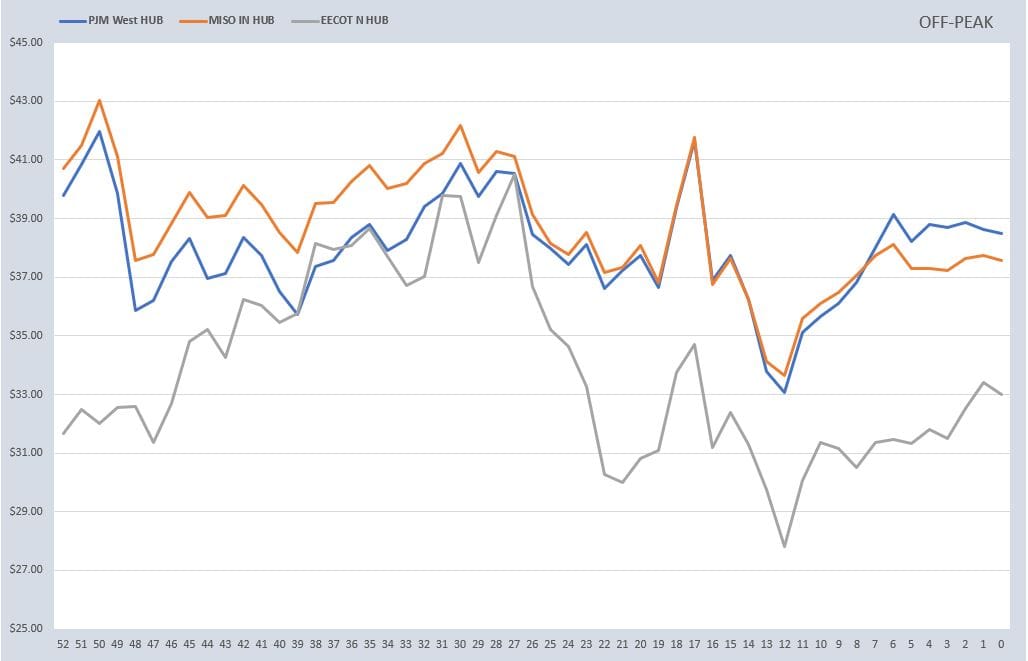
RTO ATC, PEAK, & OFF-PEAK CALENDAR STRIP
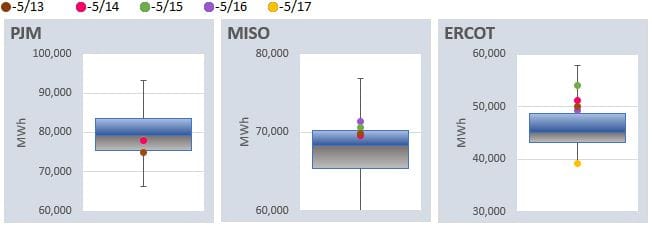
DAILY RTO LOAD PROFILES
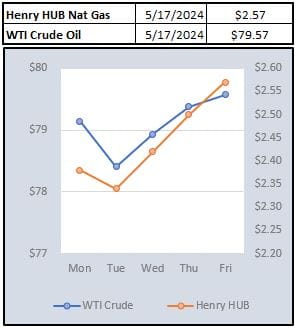
COMMODITIES PRICING
Not getting these updates delivered weekly into your inbox? Let's fix that, click the link below: