Weekly Power Outlet US - 2024 - Week 31
WPO Beach Day, PJM Capacity, Nat Gas Storage


WPO Beach Day, PJM Capacity, Nat Gas Storage
Energy Market Update Week 31, brought to you by Acumen.
For More Updates Like This, Subscribe Here!
This week's WPO is coming from the beach with a $8 cold brew (no nothing magical about it) and a laptop. Please excuse the abbreviated version as we try to capture any ray of sun presents. Hurricane remnants and beaches don't go great together.

The dust has sort of settled on the PJM 25/26 BFA, and there is still some what happened questions. The easy answer is still, lower generation and higher load, but we are including the PJM executive summary to try to bring some clarity to the conversation, or not, given the technical aspects and acronyms that go with it.
In a way way over simplified conversation we might add this as well. Historically, PJM has run their capacity auctions more or less using historical data from generation. Again, very over simplified, but if you ran your generator 80% of the time, you got credit for a like amount of generation against your nameplate capacity, or said another way, your max output. Because of some recent events and the structure of the market, PJM has placed some nuance or conditions on your 80% number. Not our example and apologize for not remembering who to give credit, but think of a bunch of gas plants on the same pipeline, should that pipeline have issues, all plants are down, not just one. Because of that, a little was taken off the historical generation by PJM when considering the reliability of each unit resulting in less MW available to clear the auction.

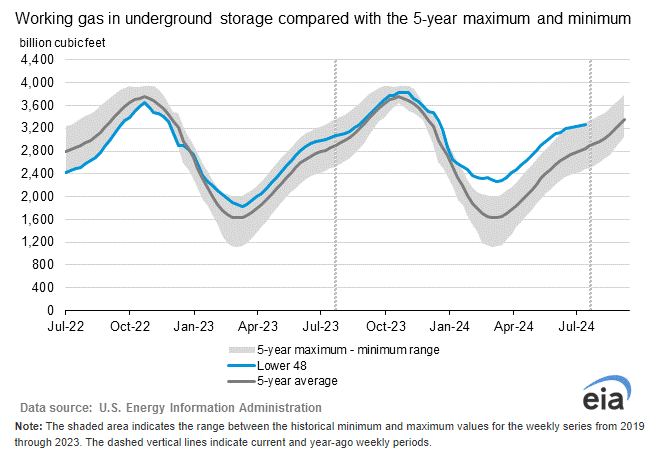
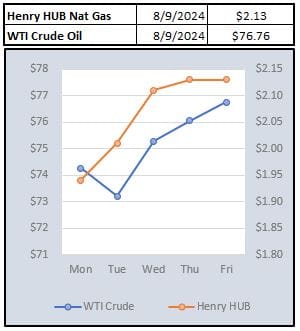
Natural gas has had a rare steady rally this week as the front month has moved from near $1.90/MMBtu to around $2.20 this morning. EIA storage numbers showed a build of 21Bcf which was inline with expectations. The chart below gives a good visual on where storage is compared to last year and the 5-year average.
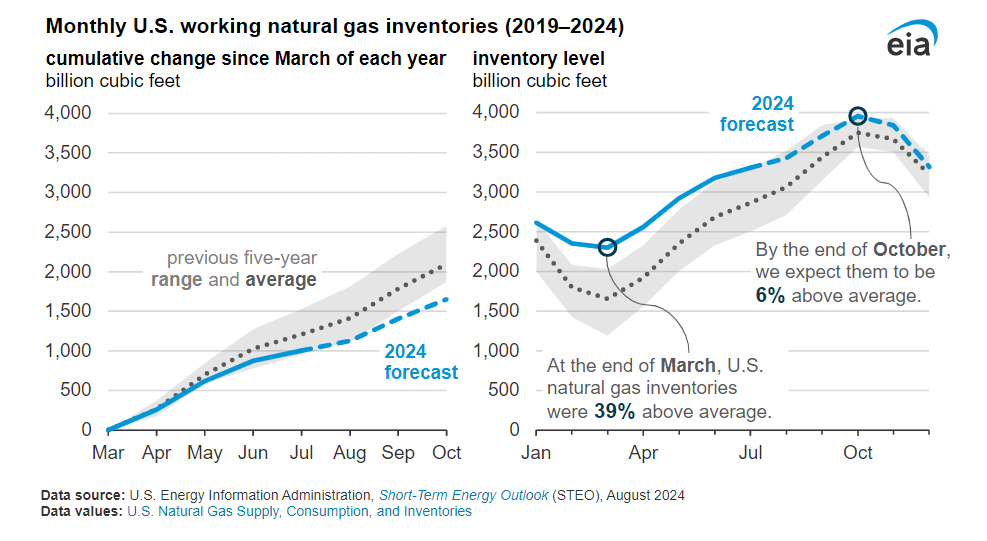
Along with weekly storage, EIA's August Short Term Energy Outlook (STEO) had some interesting comments. Looking at the charts below, EIA is calling (right) for the highest level of storage going into winter we've seen since November 2016. Conversely, given the historical storage levels to date, EIA is forecasting (left below) injections well below historical levels. While the math on all this makes sense, it is worth considering some of the comments we've heard in earnings calls from natural gas producers over the last two weeks. If you are a reader of the WPO, you know we are fans of earnings season for no other reason that you get to hear what management teams are thinking about in our world. In the interest of time, and the sun actually breaking through for a second, we will summarize that in almost every release we've listened to or read, production cuts are on the table at these prices. As read many times on these pages, in the commodity world, the cure for higher or lower prices, is higher or lower prices. It looks like we might be reaching the cure for lower prices.
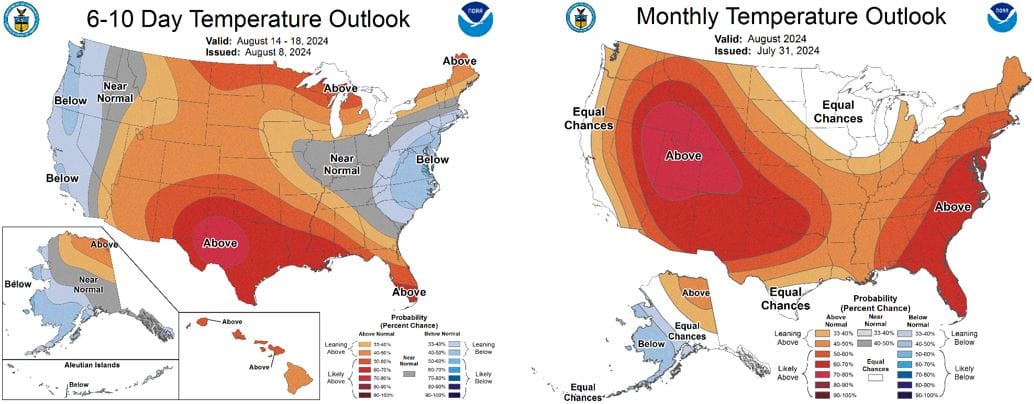
NOAA WEATHER FORECAST
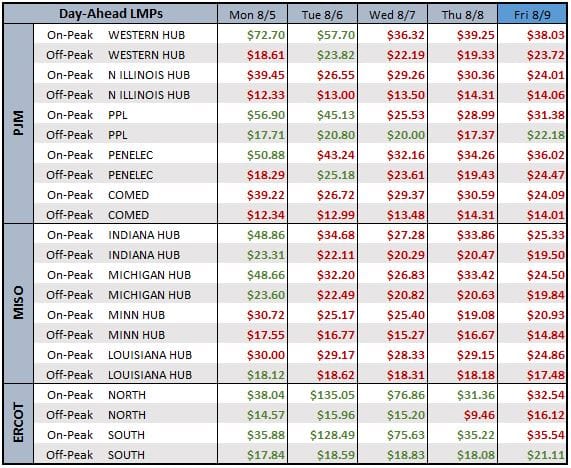
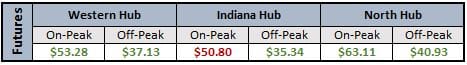
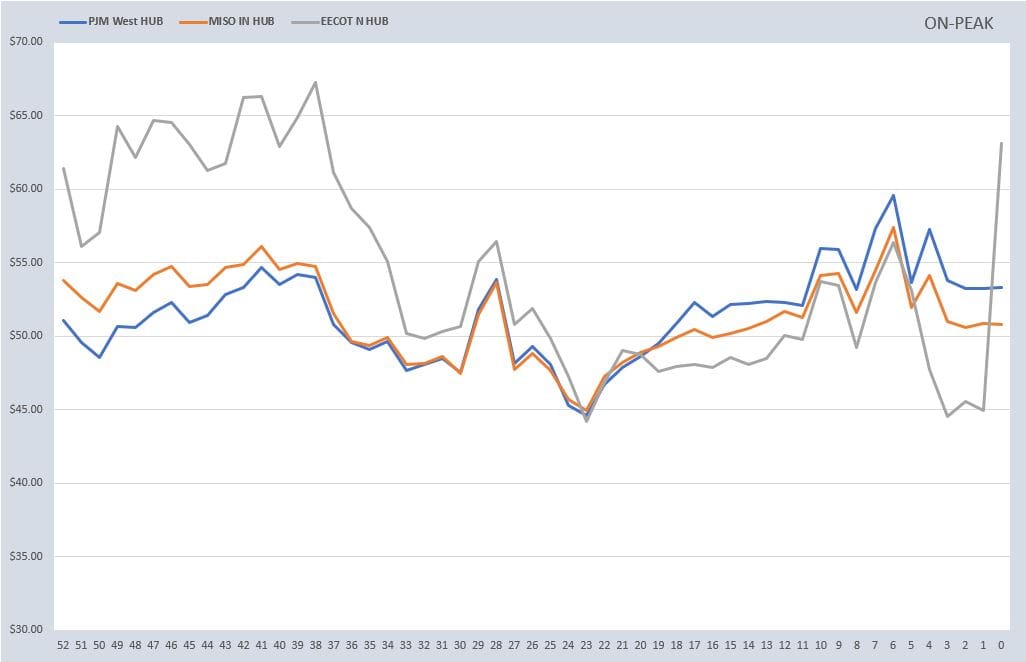
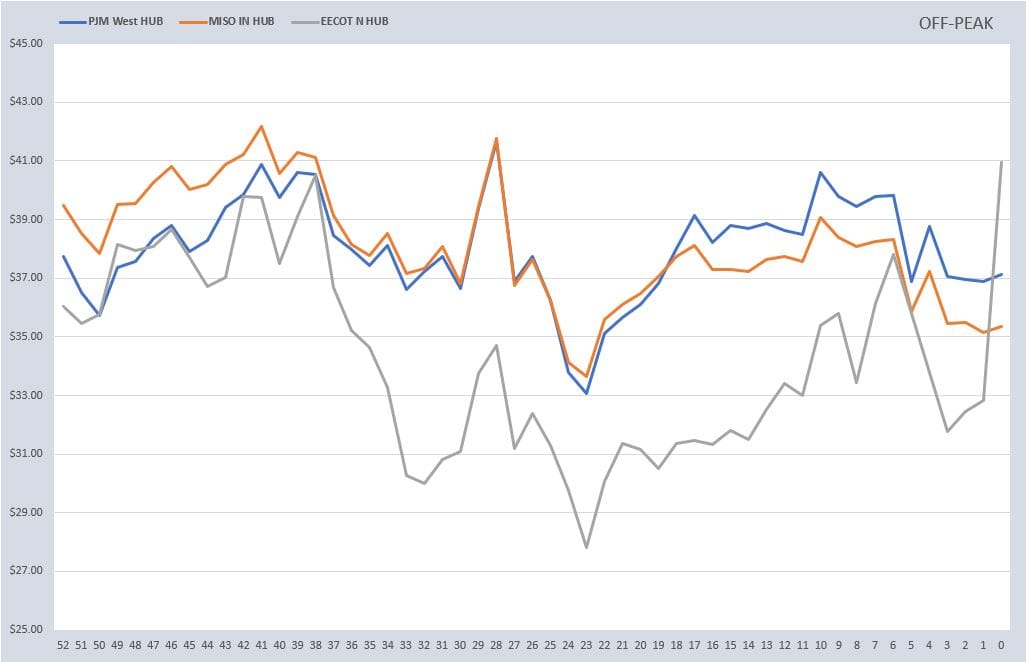
DAY-AHEAD LMP PRICING & SELECT FUTURES
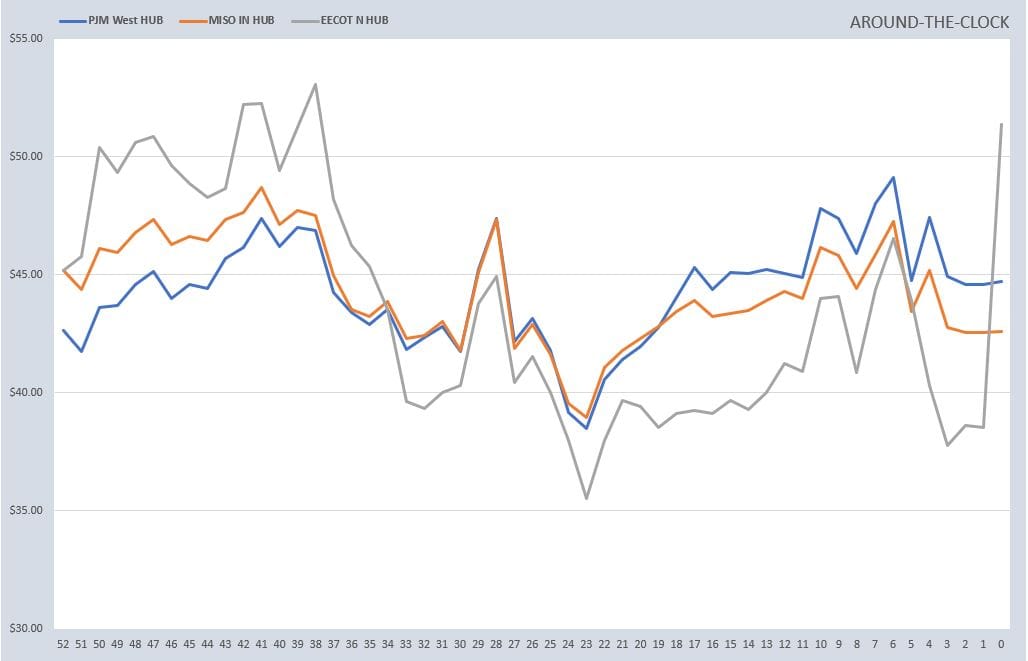
RTO ATC, PEAK, & OFF-PEAK CALENDAR STRIP
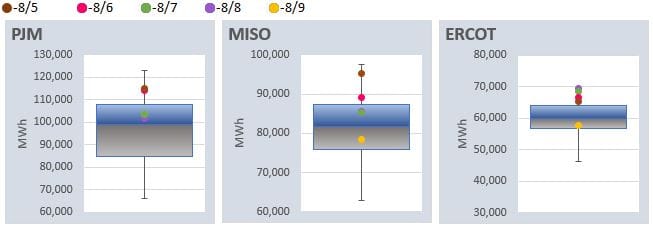
DAILY RTO LOAD PROFILES
COMMODITIES PRICING
Not getting these updates delivered weekly into your inbox? Let's fix that, click the link below: