Weekly Power Outlet US - 2024 - Week 36
Natural Gas, AI Load Growth

Natural Gas, AI Load Growth
Energy Market Update Week 36, brought to you by Acumen.
For More Updates Like This, Subscribe Here!
Other than a storm racing through the Gulf and up through the coast into the mainland, nothing really happened today. We were asked a few times about Francine and natural gas and why we really never saw a big price movement.
For starters, the new post-fracking gas market is much different than the old school pre-fracking. In the "olden" days, a storm in the Gulf meant a good chunk of US production came offline and the supply/demand dynamics pushed prices higher. In the new world, Gulf storms now disrupt gas export leaving gas stranded in the US reversing the supply/demand picture.
Since natural gas was the topic of the week, we decided to cut and paste some interesting charts and tables from the EIA gas supply weekly. For right now, the only two data points that matter is storage (both here and in Europe) and production. Looking at the first, we have finally stopped making new 5-year envelop highs, with gas in storage. While that might seem a bit bullish natural gas, it really only means the market is pushing up last year comparable numbers and more storage inventory needs to be worked off.

The second chart is more telling. As we've mentioned over the summer, production in natural gas needs to curtail, basically get below 100 before some relief can come on the supply/demand picture. As we can see, since early spring production has outpaced US and export consumption. There have been a few times over the last couple months where it seemed some hot weather and export had closed the gap, but those were short lived, and we've once again opened a gap. The tables below give a good breakdown of the supply/demand chart.


One additional note on natural gas was mentioned this week in the WSJ. While the front month has traded around $2/MMBtu, we've seen the winter strip trading near $3. At or above $3, most producers are still ok selling forward contracts and delivering physical gas.

Compute power has gotten a lot of attention on these pages and elsewhere over the last half of the year. We spoke about market volatility this week at the American Public Power Association's Business and Finance Conference earlier this week. While EVs are still a big topic, AI has taken over the discussion as utilities grapple with the issue.
This week we got to see a real time issue as FERC weighed in on a MDU/Basin Electric and SPP/MISO issue. While we are going to oversimplify for content space, we are attaching to FERC library.
Williston, ND is known for the Bakken oil fields and cold weather. Cold weather and abundant fuel stocks (flared gas) have been inviting to data centers and crypto miners. As with most of these new loads popping onto the grid, the infrastructure needs to be updated to accommodate. In some cases, a new load for one, means higher congestion for another spurring an argument about who pays. Again, the docket is worth the read.
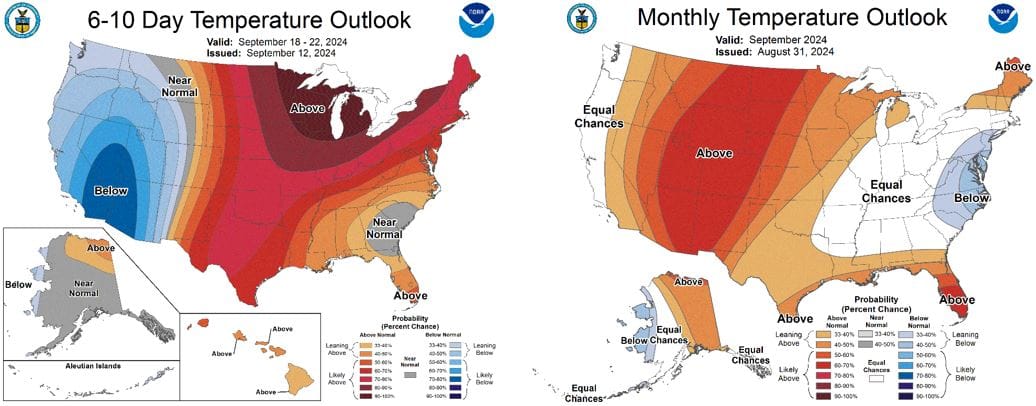
NOAA WEATHER FORECAST
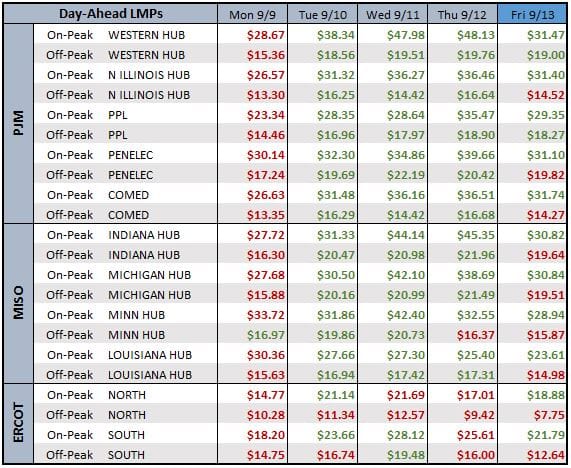
DAY-AHEAD LMP PRICING
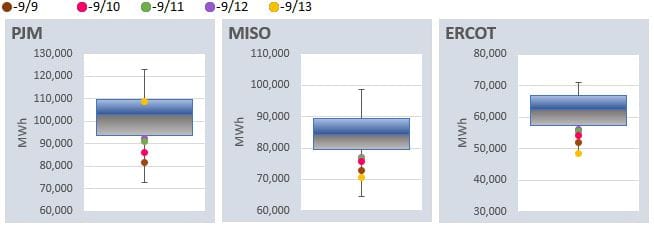
DAILY RTO LOAD PROFILES
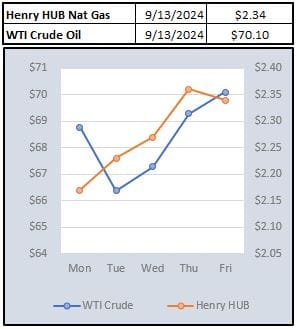
COMMODITIES PRICING
Not getting these updates delivered weekly into your inbox? Let's fix that, click the link below:


