Weekly Power Outlet US - 2024 - Week 41
The Demise-ish of Coal, More Nuke, PJM Capacity


The Demise-ish of Coal, More Nuke, PJM Capacity
Energy Market Update Week 41, brought to you by Acumen.
For More Updates Like This, Subscribe Here!
IEA recently released their WEO24, or World Energy Outlook 2024. If you've been a long-time reader, you know we have a love-snicker relationship with them. That mostly stems from our opinion that they do unbelievably detailed work, but with a narrative behind it.
This report is no different. It is incredibly well researched with all kinds of very interesting data points. Global energy usage, world birthrates, cooking patterns in Africa, shipping lanes, and our favorite below, are just a few of the topics covered to determine an energy outlook. We can't recommend this report enough with the understanding you may not agree with all the contents. Again, our favorite.....
Anyway, we found it very interesting that IEA has revised their coal usage numbers substantially higher.
In the STEPS, the outlook for coal has been revised upwards particularly for the coming decade, principally as a result of updated electricity demand projections, notably from China and India. Total coal demand is 300 million tonnes of coal equivalent (Mtce) or 6% higher in 2030 than in the WEO-2023. Even with this revision, coal demand declines by an average of 2% each year through to 2050.
STEPS is their base case when modeling results. You can see in the statement, from last year's forecast to this, the targeted usage of coal has been increased by 6%. We've been in the camp that has been saying there is just no way the growth in electricity can be served by intermittent renewables without baseload, so we aren't shocked. We are somewhat shocked that IEA is now in our camp.

In other baseload news, Amazon and Google announced that they are following the lead of Microsoft and investing in nuclear energy to meet the demand of their growing datacenters. Part of their plan is to grow investments in small nuclear reactor technology. It's interesting, if you've been alive for two years, you grew up in the anti-nuclear movement that included many heavy weights including groups like the Sierra Club. Going around on X this week was commentary about how even Sierra Club has included some nuclear in their electricity policy. Amazon, Google, and Microsoft embracing nuclear are helping change the narrative on nuclear. As we've always said, renewables are easy to get behind in the context of clean climate. Ask someone to trade fast searches, doorstep delivered toilet paper, and lightning speed Call of Duty, and renewables become a tougher sell.

Late last week PJM delayed its next rounds of capacity auctions by up to six months. This comes on the heels of the 10x increased results for the 25/26 year just released a few weeks ago. As a reminder the next round was to occur in December, and this was PJMs attempt to basically catch up on planning. We've been asked for some opinion on this, and frankly, we have none. As the kids say.....

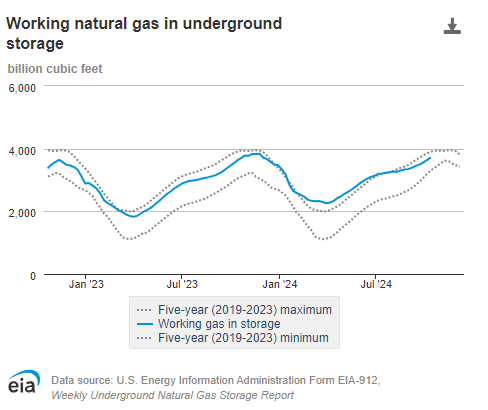
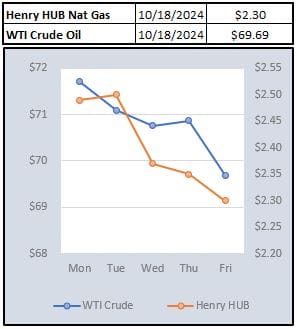
The EIA storage report showed a build of 76 Bcf vs forecasted 80 Bcf. Dry natural gas production decreased by 0.1% (less than 0.1 Bcf/d) to average 101.5 Bcf/d. The sell off in gas has continued as the market continues to be well supplied. US Electricity futures have continued to mirror gas and are now trending to YTD lows not seen since this spring.
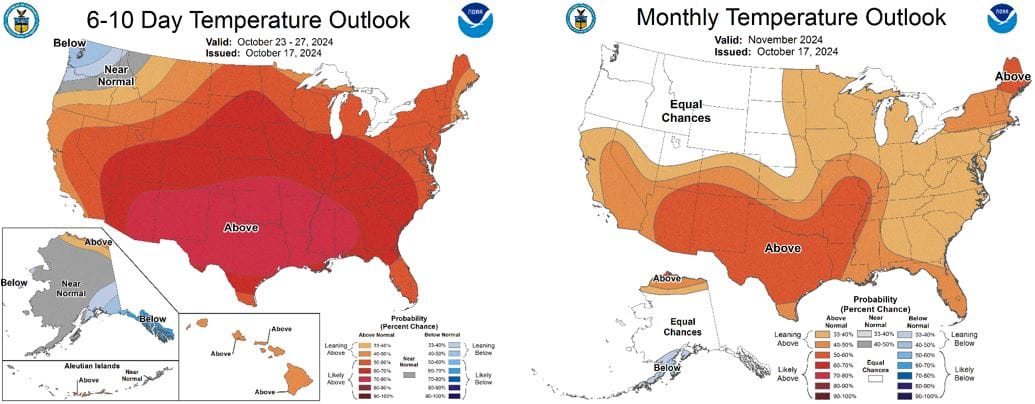
NOAA WEATHER FORECAST
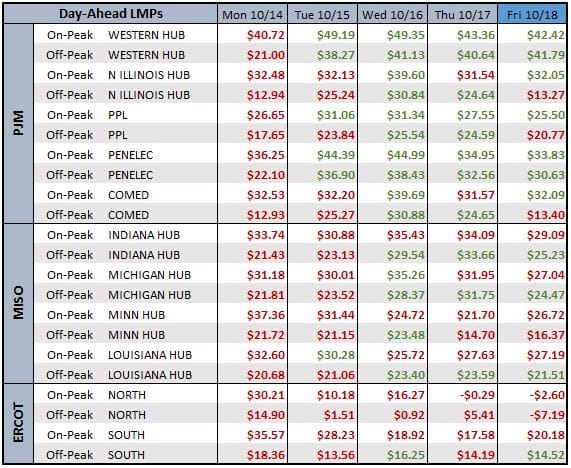
DAY-AHEAD LMP PRICING & SELECT FUTURES

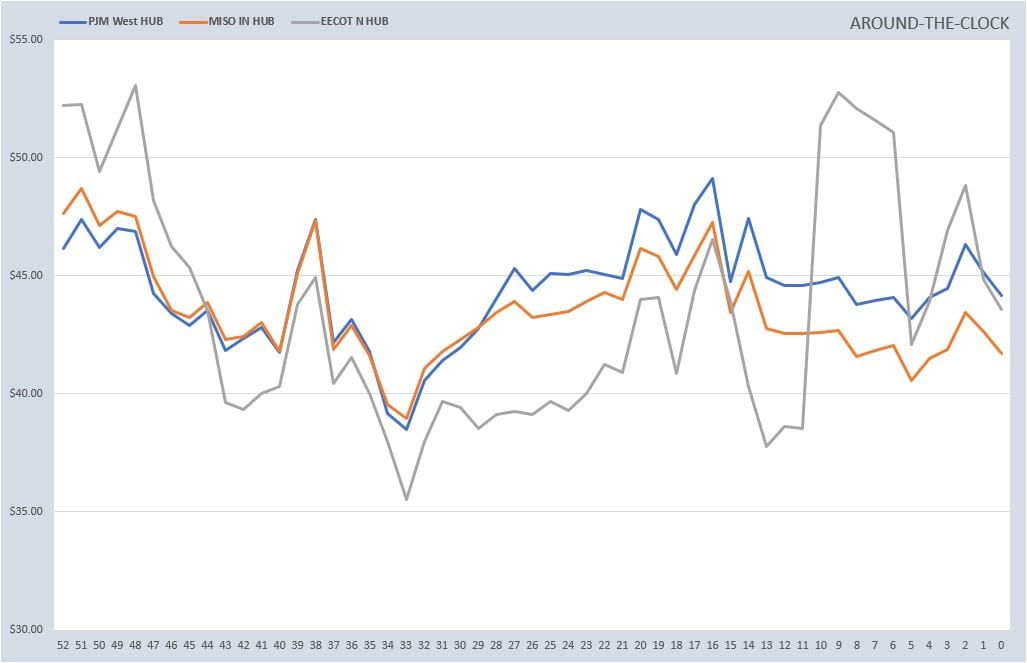
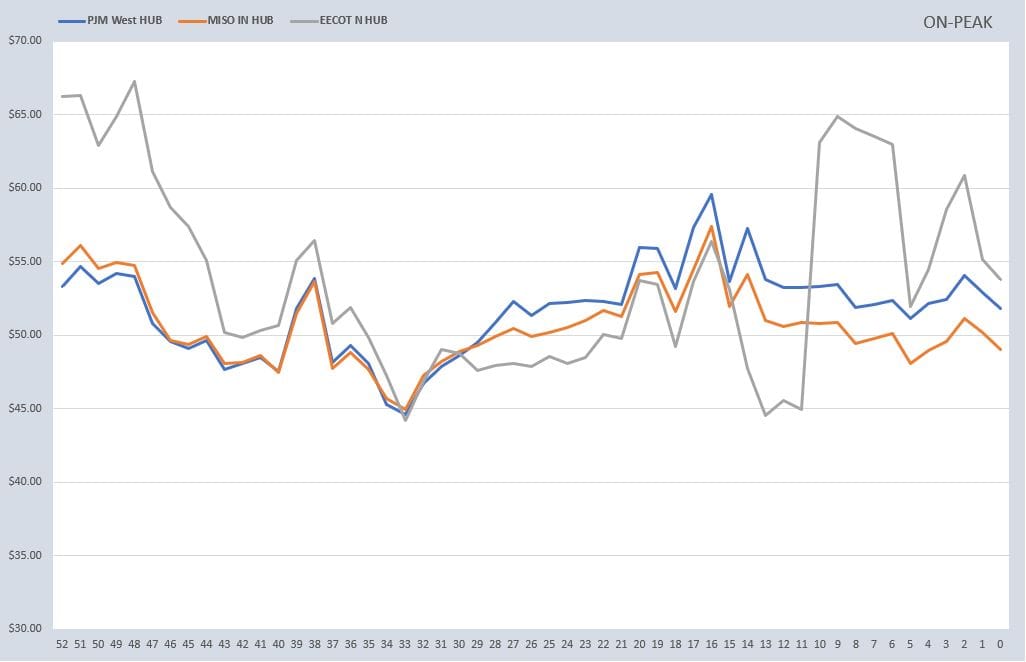
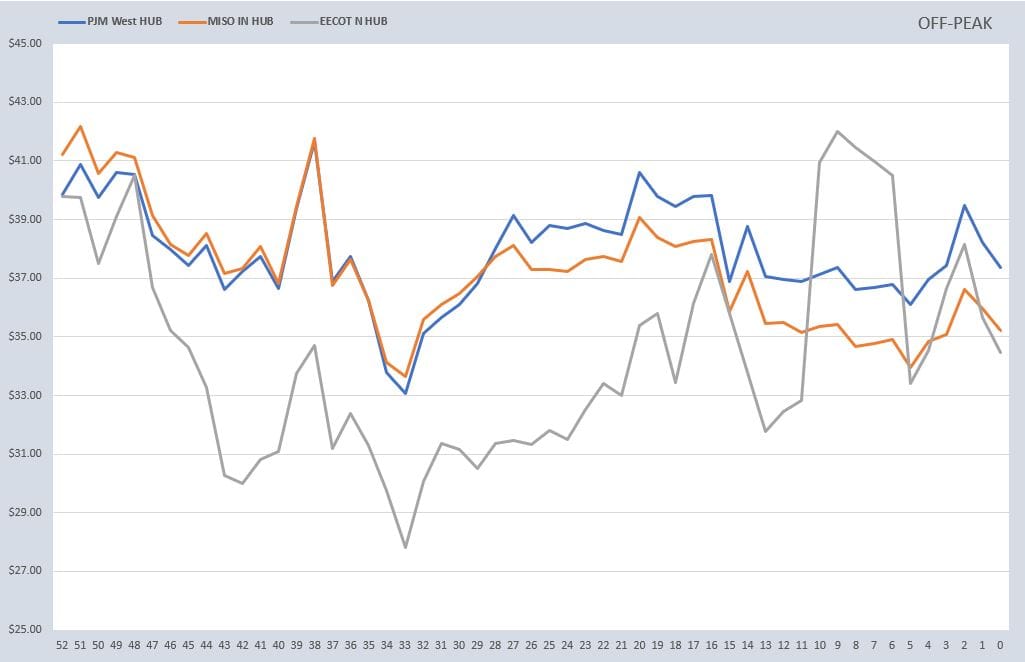
RTO ATC, PEAK, & OFF-PEAK CALENDAR STRIP
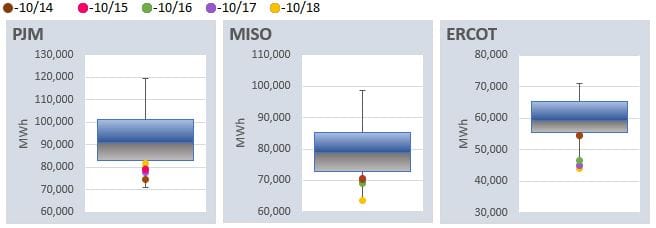
DAILY RTO LOAD PROFILES
COMMODITIES PRICING
Not getting these updates delivered weekly into your inbox? Let's fix that, click the link below: