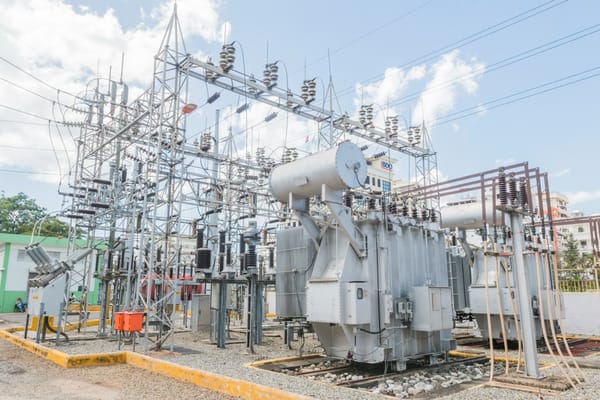
Weekly Power Outlet US - 2024 - Week 48
Weather, Gas Storage, Duck Curve

Weather, Gas Storage, Duck Curve
Energy Market Update Week 48, brought to you by Acumen.
For More Updates Like This, Subscribe Here!
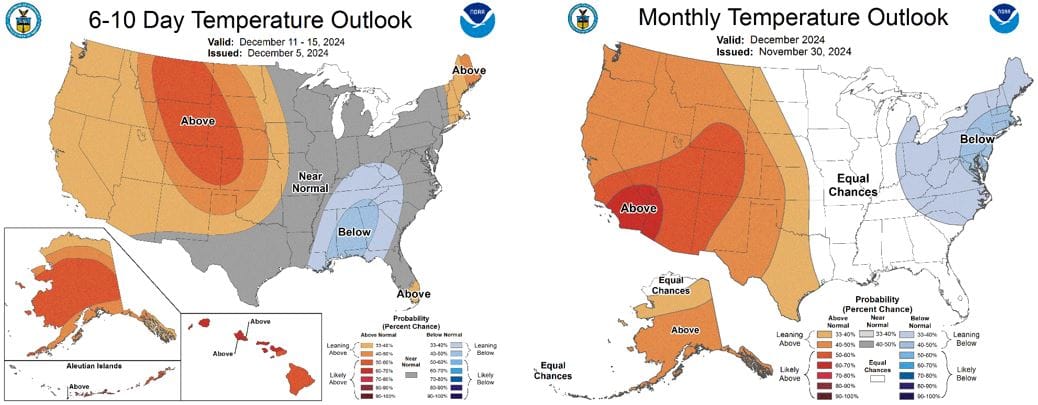
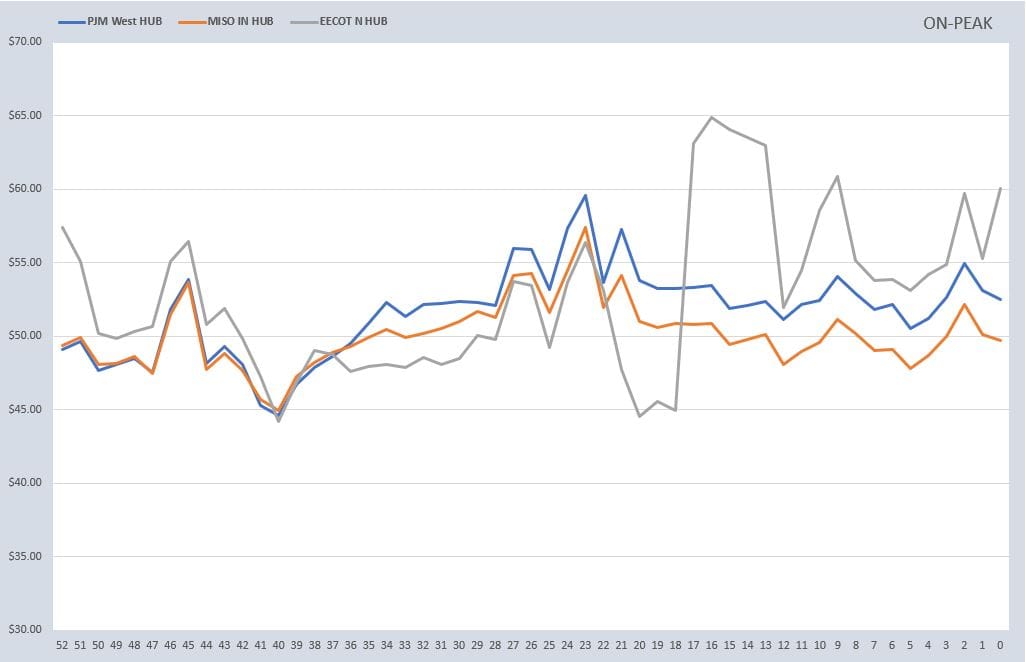
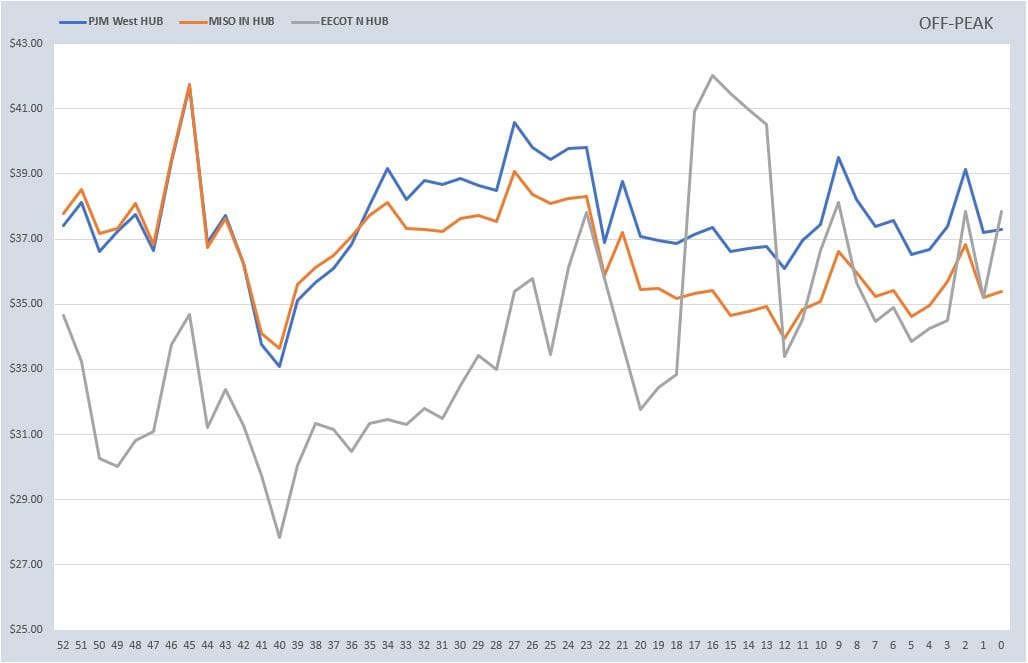
It's hard to say what has had more volatility over the last couple weeks, crypto prices, stock prices, or weather forecasts. The short-term forecast for December has been freezing cold to above normal and back again with a shot of normal. As expected, that has led to some interesting pricing in the gas and electric futures markets. As seen below, the markets have been a little choppy on the 1-year strip with a lot of the volatility coming in the front month.
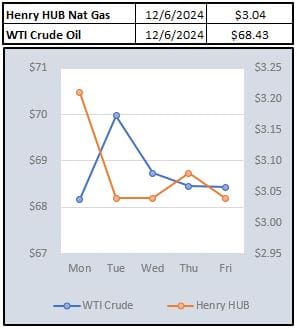
While the weather was driving the spot prices on natural gas, and the front months of the curve, EIA was busy releasing plenty of data to remind us there will be plenty of gas this winter...unless of course, there isn't. The real interesting fact is that we now have the most gas in storage heading into the withdrawal season since 2016. Given production numbers can be ramped if needed, it is going to take a decent cold winter either here or in Europe to make a dent. I vote Europe, especially if it involves the snow seen last week.


Just before Thanksgiving, ISONE put out an interesting article that included the fact that on November 25, the ISO recorded its 100th day of a Duck Curve for the year. The Duck Curve was made popular in California, and it described the shape of the demand curve as behind the meter solar reduced the grid demand midday instead of the traditional overnight hours. As more and more solar has come online, this has become more and more the norm. 100 days of midday demand being below the overnight seemed nonsensical just a few years ago.

NOAA WEATHER FORECAST
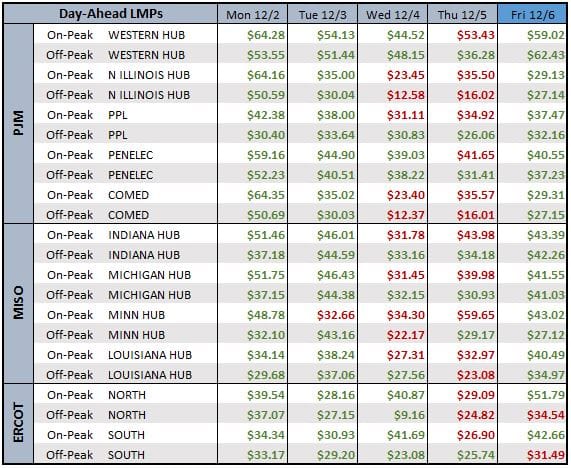
DAY-AHEAD LMP PRICING & SELECT FUTURES

RTO ATC, PEAK, & OFF-PEAK CALENDAR STRIP
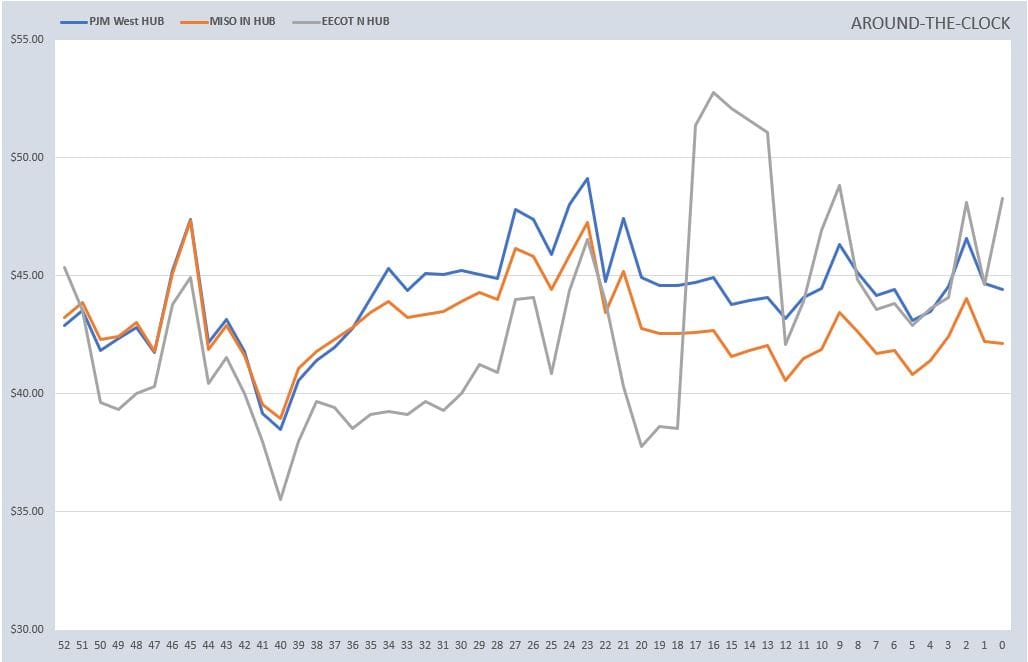
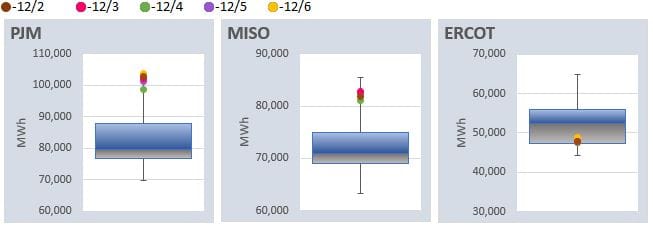
DAILY RTO LOAD PROFILES
COMMODITIES PRICING
Not getting these updates delivered weekly into your inbox? Let's fix that, click the link below:


