Weekly Power Outlet US - 2024 - Week 6
The Fall of Natural Gas & Driver's Education Lesson


The Fall of Natural Gas & Driver's Education Lesson
Energy Market Update Week 6, brought to you by Acumen.
For More Updates Like This, Subscribe Here!
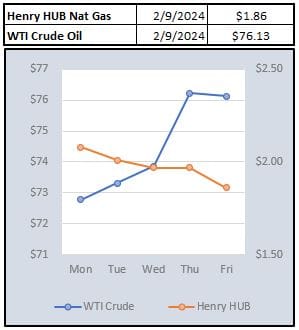
There's an old axiom in the commodities world that goes something like, "the cure for low or high prices is lower or higher prices.". Natural gas, and thus, electricity is certainly trying to prove that. Natural gas prices have been in a complete free fall for the last month. Since January 12th, natural gas prices are officially down over 40%. As of this morning, the statement "natural gas hit its lowest level since September 2020" will become true for the third consecutive day.
Yesterday's EIA storage numbers of a withdrawal of 75 Bcf compared to the week five 5-year average of 193 Bcf. After the January cold snap, storage levels were slowly creeping in line with last year's and the 5-year average. After this week, forget that as storage is now 7.8% higher than last year and 10.6% higher than the 5-year average. Given the typical draw, and still warm weather forecasts, some traders are predicting that number moves to almost 20% above the 5-year average. Those expectations have the front month gas future contract trading around $1.85 which seems like it can't go any lower. Remember the old trader's axiom.
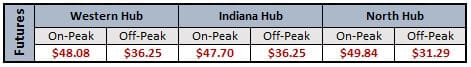
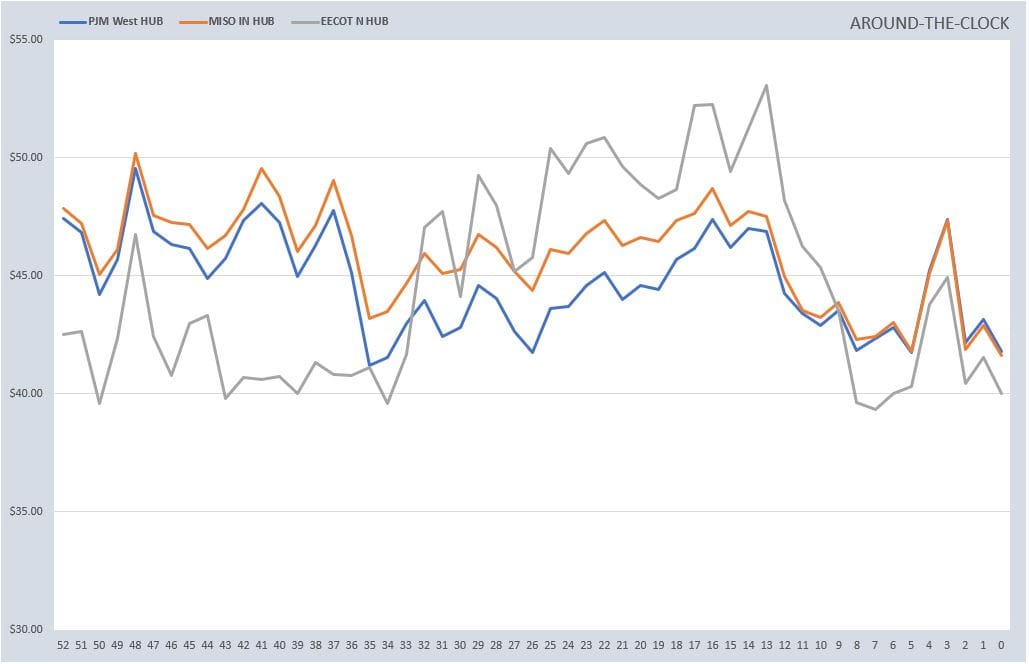
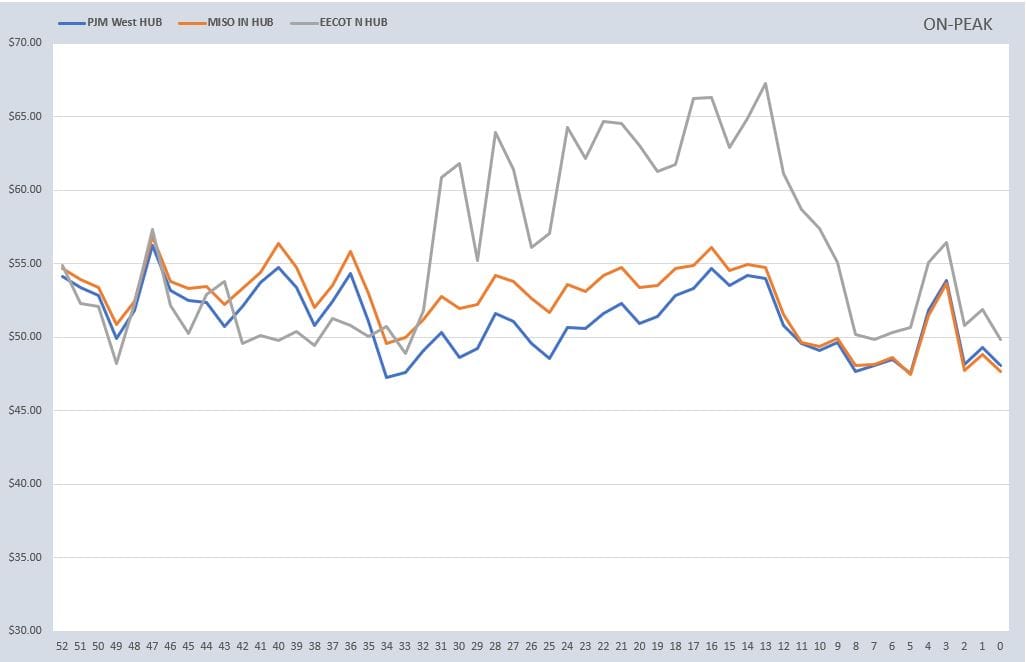
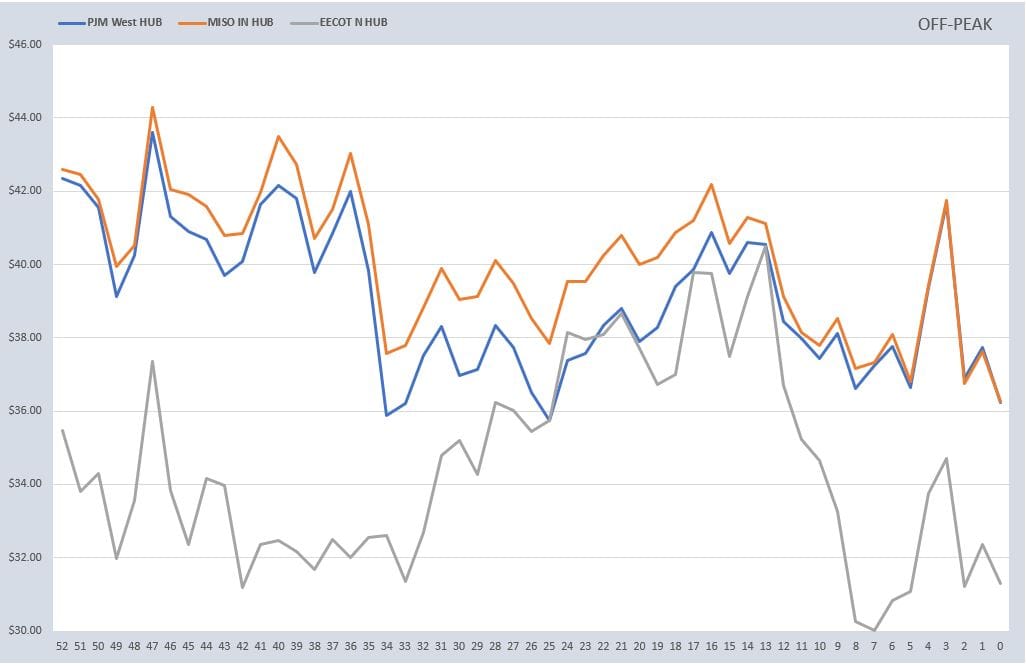
The long part of the gas curve is sort of holding up. Winter 25 has come off a touch, but not nearly as drastic as the front months. Looking at the electric futures (charts below), we can see some technical levels of support right here. We've often commented about $50 Calendar On-Peak for the ERCOT, MISO, and PJM zones we follow, and all have broken. We'd also note, $40 on the around the clock strip looks to be a key level of support for those with a technical eye.
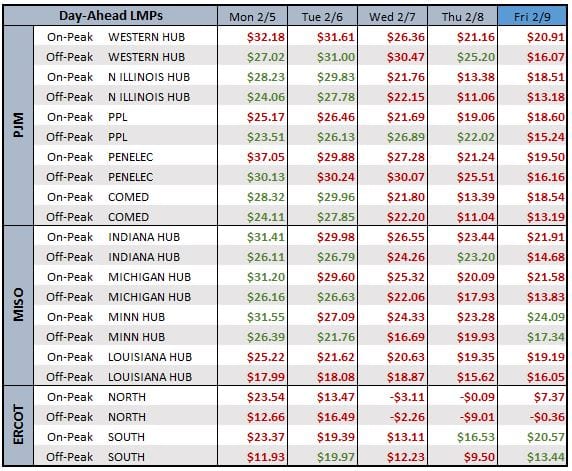
On the Day ahead front, electricity prices are certainly reflecting the levels of natural gas and the weather-related load. Just looking at prices, I wish you a happy May weekend, bring a light jacket, it might be breezy.

I may be dating myself, but back when I was learning to drive, we had to take driver's education classes in high school. It may seem strange, but back then the idea of wearing seat belts was just starting to become second nature. Instead of trying to rationally reason with a bunch of teenage drivers the merits of seatbelts, our teach just showed movies of car crashes trying to scare us into acceptance. I'm not sure, but I suspect this way of teaching has not survived to current day.
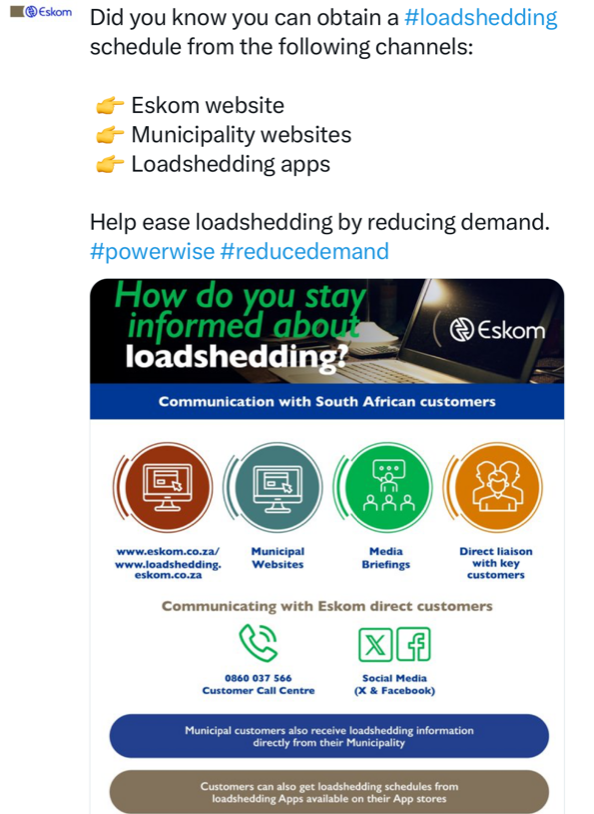
Anyway, our point? Given the nature of our business, grid reliability is sort of one of the mandates of our audience. For that reason, we usually make sure to add links and comments to reliability studies when presented by FERC, ISOs, or NERC. Since it's a slower news week, how about the driver's education model? We turn to our old punching bag, Eskom. For those new here, Eskom is the South African government run electricity generation and transmission company. For various reasons, their reliability record has been spotty at best. That's a discussion had in the past, and maybe the future, but for right now we will note the following. Imagine having to create a webpage, X account, and power point to help educate customers on daily loadshedding? Below is the part of the driver's education movie where you look long enough to get the point, but not long enough to leave a nightmare impression.
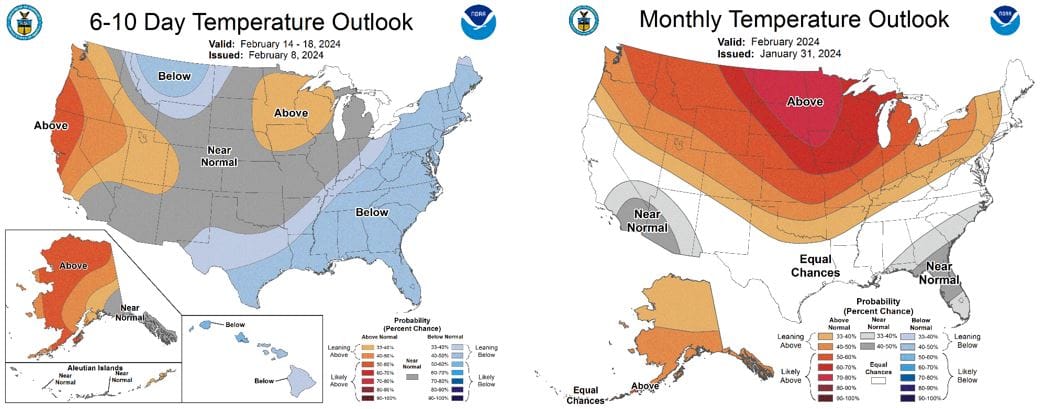
NOAA WEATHER FORECAST
DAY-AHEAD LMP PRICING & SELECT FUTURES
RTO ATC, PEAK, & OFF-PEAK CALENDAR STRIP
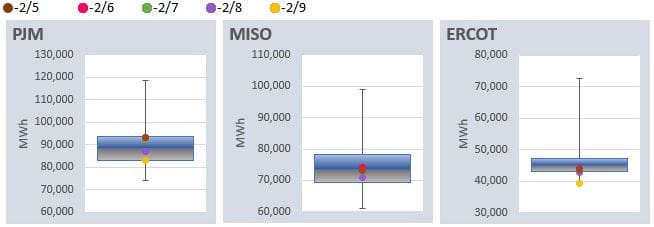
DAILY RTO LOAD PROFILES
COMMODITIES PRICING
Not getting these updates delivered weekly into your inbox? Let's fix that, click the link below: