Weekly Power Outlet US - 2025 - Week 2
Gas/Electricity rally, Power Import by State, Nameplate Capacity Factor

Gas/Electricity rally, Power Import by State, Nameplate Capacity Factor
Energy Market Update Week 2, brought to you by Acumen.
For More Updates Like This, Subscribe Here!
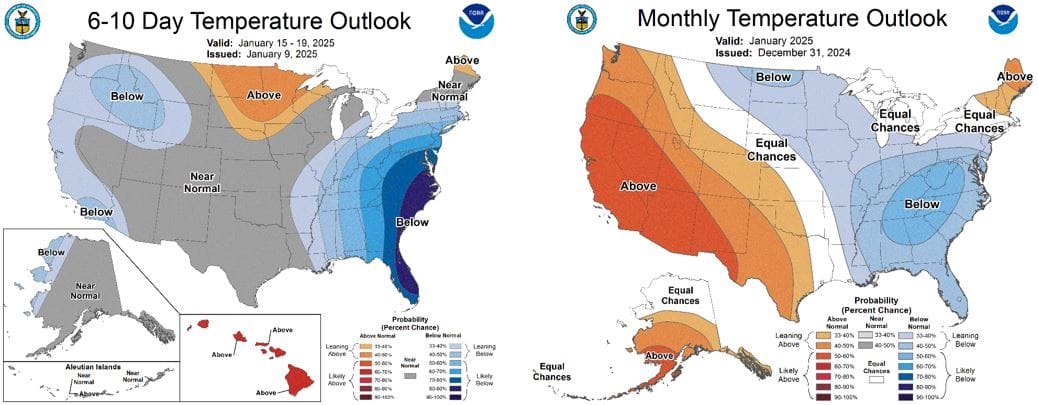
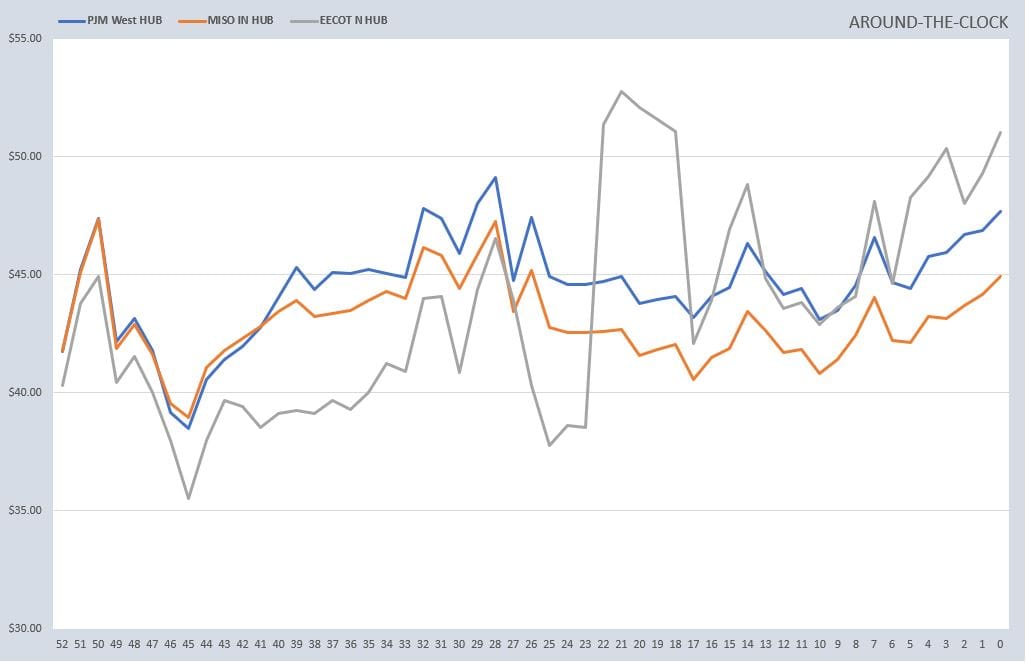
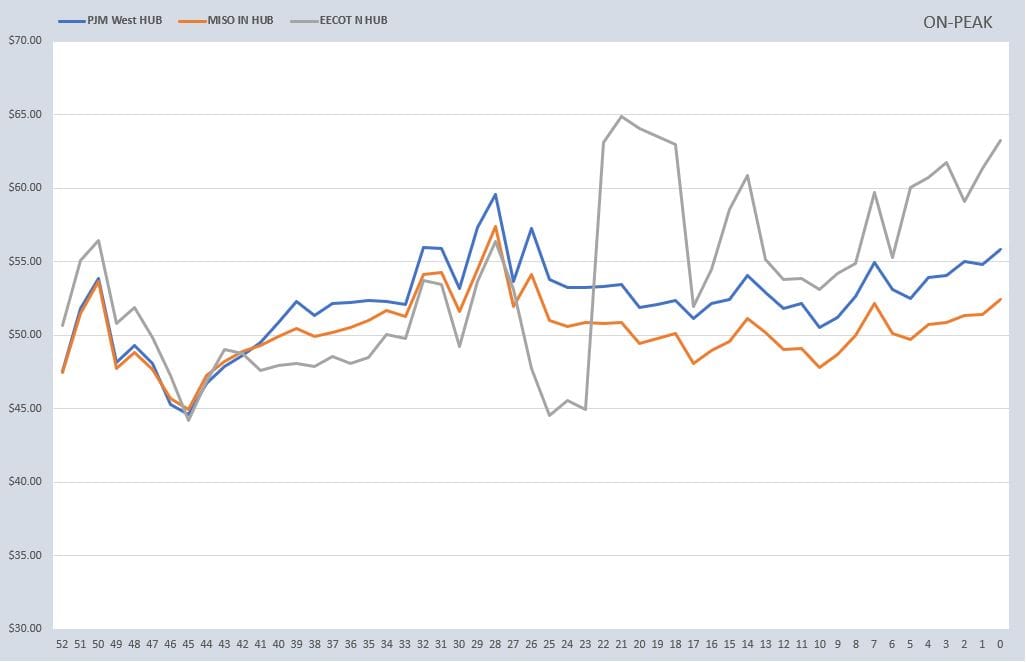
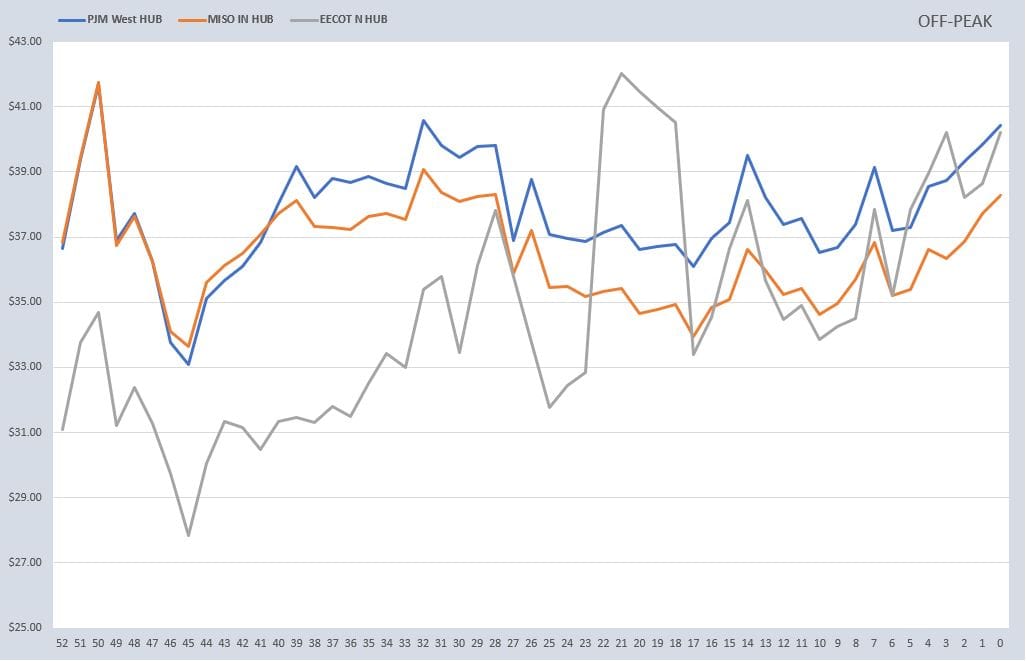
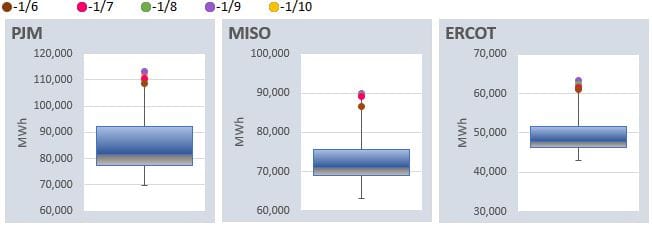
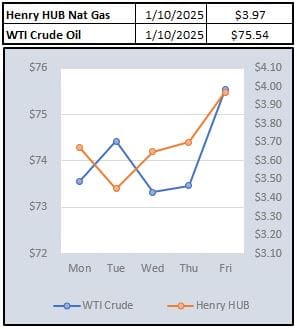
It seems the turn of the calendar has ushered in winter, or at least the threat of winter as shown in the natural gas and electricity futures. February (front month) gas futures are encroaching on the $4 level as of this morning. Looking at the strip around the clock electricity futures for the ISOs we chart, we can see the trend is following gas as some 52-week highs might be in sight.
Depending on what, or who you read, there are plenty of data points to point to a rally. EIA storage data came inline this week, and the US is still seasonably above historical levels. The like data from the EU shows storage levels near the five-year average of 68%. The real story there is just a couple months ago the EU was sitting at the higher envelope of storage above 95%. This move shows a decent drawdown that last couple months on colder weather and increased power demand. Again, weather here is also adding to the rally as everyone's new favorite data point, guessing the volume on well freeze offs, has risen. The latest estimate we saw was for up to 6 Bcf in US freeze off with colder weather moving in. Honestly, we have no idea how that number is calculated or the relevance for more than a day or two.
It's probably worth mentioning that natural gas, although a more impressive move, is rising in correlation with other commodities. The stronger dollar, higher interest rates, and inflation data has some speculative money making its way back into commodities, and what better commodity than natural gas with a winter supported story and data.


The end of the year means some interesting data dumps for EIA. As stated many times, we really appreciate all the data EIA presents, even if somewhat dated as below. The following snapshots are of the import/export states of electricity. As the headline states, Virginia is the top net importer of 2023. This shouldn't be a surprise given the data center footprint of Virginia. What is interesting, this is 2023 data and 2024 should be an even bigger number as data centers continue to be installed.
It's worth noting the second chart which shows Virginia supplanting California as the top import state. As noted, the growth in data centers in Virginia overlapped with California demand falling 5% and hydroelectric picking back up. Also, California has benefitted from continued adoption of roof top solar which has helped cut into external demand.


Over the holiday break, at one of the too many holiday parties attended or thrown, the discussion over drinks of name plate capacity vs capacity factor came up regarding generation assets. Yes, we are well aware this is proof we are not the life of the party. Anyway, long story short, the discussion was born out of the question someone posed regarding a headline replacement of a coal plant with solar which has been a headline here in the home state of Minnesota.
Ironically, earlier this week more than a few industry insiders and reporter types we follow were talking about Germany reaching 100 GW of installed solar capacity at the end of 2024. Interestingly enough, Fraunhofer Institute for Solar Energy released a report that Germany generated 72.2 terawatt hours (TWh) in 2024. Doing some back of the envelope calculations, and using a 2024 rough average of generation (started the year with 84 GW of capacity), that works out to somewhere around 9% capacity factor. The response of our holiday party discussion seems applicable here...."Oh!".
NOAA WEATHER FORECAST
DAY-AHEAD LMP PRICING & SELECT FUTURES


RTO ATC, PEAK, & OFF-PEAK CALENDAR STRIP
DAILY RTO LOAD PROFILES
COMMODITIES PRICING
Not getting these updates delivered weekly into your inbox? Let's fix that, click the link below:


