Weekly Power Outlet US - Week 22


More Senate Testimony, EIA Storage, and New Oil Index.
Energy Market Update Week 22, brought to you by Acumen.
For More Updates Like This, Subscribe Here!
Yesterday the US Senate Committee on Energy and Natural Resources continued hearings on the reliability and resiliency of the electric grid. Those invited to testify were NERC and PJM CEOs James Robb and Manu Asthana, research scholar Dr. Melissa Lott, and CEO of Associated Electric Coop David Tudor. Unlike a lot of hearings in the US House and Senate, this committee's hearings are usually informative and include real debate void of feigned outrage. Last month, this committee hosted the FERC commissioners, and the conversation was somewhat alarming but not unexpected. The group that spoke yesterday said very little to alleviate those concerns.
One of the main topics discussed was the EPA's unrealistic mandates of cutting fossil fuels in the near term with no plans in place to fill the transition gap. Mr. Tudor spoke very bluntly, commenting that the EPA is calling for the retirement of coal plants before even the first small modular reactors (SMRs) are scheduled to be online. That doesn't include the period of time need to take the first one, test it, modify it, and scale it.
Also discussed were RTO new generation queues filled with projects that are highly speculative and likely to never get built. While this isn't considered breaking news, there was some realistic conversation about the supply chain of building materials that is owned by countries not necessary considered to be our best friends.
Ultimately, the testimony that has emerged from this committee isn't laden with answers to complicated issues most in the industry understand. For us, the fact that elected leaders are starting to have a pragmatic discussion about these issues is a small win.
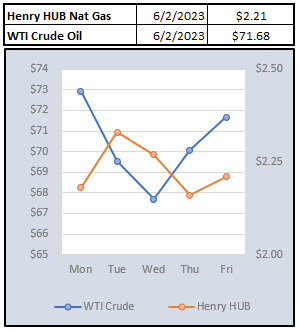
EIA storage data showed a build of 110 Bcf which was above expectations. The build was well above last year's 82 Bcf and is roughly 10% higher than the five-year average. As of this report, storage levels continue to be about 30% higher than the five-year average, and nothing in the production or weather forecasts indicate that it could be threatened, represented by $2.20 July Henry Hub prices.

If you've followed this blog or spoken to us about electricity pricing, you know one of our points of interest is LNG. The reasoning behind that is because LNG shipping has the potential to make natural gas a fungible commodity. We saw this last summer when US prices spiked on European shortages as US domestic production was tapped to help fill the void using LNG. In the past, US production would have been captive to the domestic market with no way to help out.
The drive of our thesis has always been the oil market. Super tankers sailing the seas have allowed for the world markets to be priced by just a handful of benchmarks. The most popular are Brent and WTI which represent a blend of light sweet crude from the North Sea and West Texas. Here in the US, we usually hear oil quoted in WTI, but Brent is the world index that sees the most trading. Over the years, the output of the North Sea has waned so other European production was added to the calculation of the index. Even more recently, a concern has been that just European oil might not be a fair representation of world oil price for the most popular trading index. What to do? Starting this week, the calculation of Brent Crude will now include some Texas oil prices. The Wall Street Journal lays out the details of the change in a recent article.
While there may be no relevance to current pricing of natural gas or electricity, it is interesting to ponder what the natural gas markets would look like if Henry Hub or the Dutch TTF Index start pricing in one another.
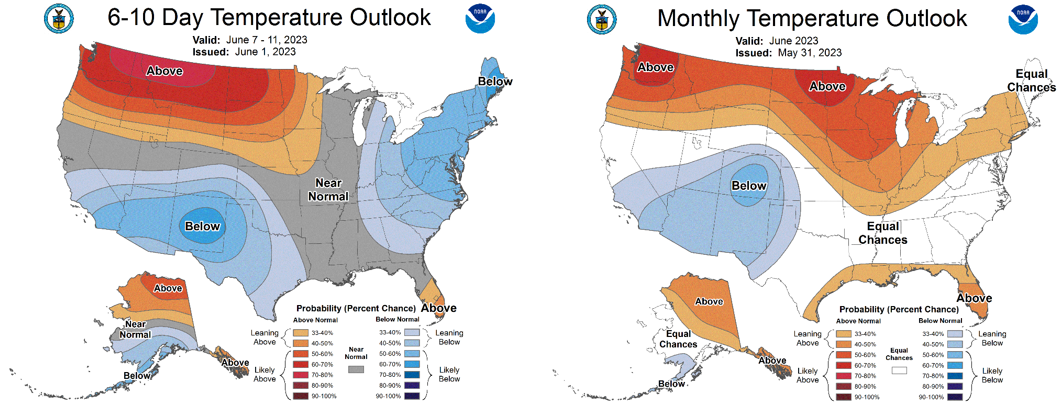
NOAA WEATHER FORCAST
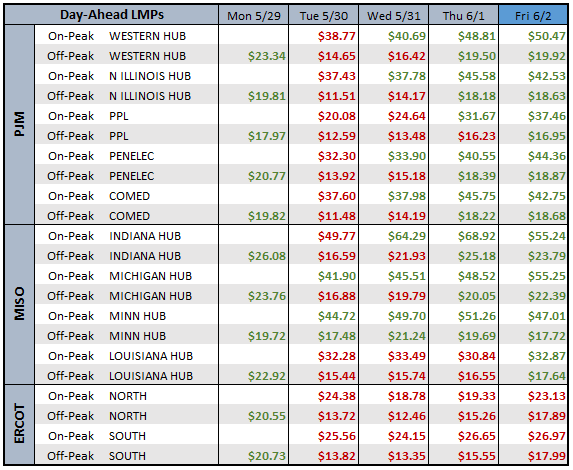
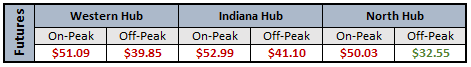
DAY-AHEAD LMP PRICING & SELECT FUTURES
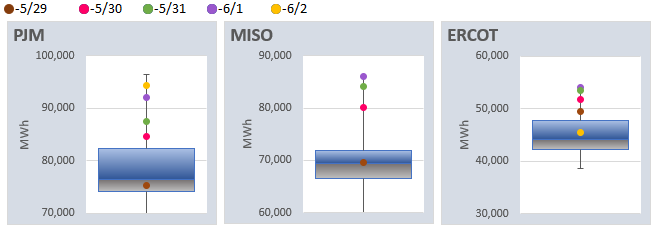
DAILY RTO LOAD PROFILES
COMMODITIES PRICING
Not getting these updates delivered weekly into your inbox? Let's fix that, click the link below: