Weekly Power Outlet US - Week 23


EIA STEO, More EIA, and Old Chart Support.
Energy Market Update Week 23, brought to you by Acumen.
For More Updates Like This, Subscribe Here!
This week, the US Energy Information Administration (EIA) released their monthly Short-Term Energy Outlook (STEO). Of interest to us is the electric forecast for summer. They expect consumption to be down slightly over last summer, citing a reduction in manufacturing activity by roughly 2%. Coal generation will continue its slide as part of the generation stack with a robust 15% decrease. Most of that will be picked up by natural gas, with EIA forecasting a 3% rise in gas generation. Solar capacity has grown 24% from last summer with additional wind, and even new nuclear coming online, expected to fill the coal gap.

More gas, less coal. Along with the STEO, EIA released Today in Energy this week, stating that this winter period (November 1 to March 31), the US reached a record for electricity generation with gas. The record is for the winter period as natural gas burn for electric peaks in the summer. According to the study, 38% of electricity produced this winter in the US was with natural gas, which is up from 35% the previous winter. Coal fell from 21% to 18% winter over winter. These statistics are for the whole country and will vary within each RTO or geographic area.
A side note here, this study may seem counterintuitive, as we report on EIA gas storage build in the summer and drawdown in the winter. Again, the report is specific to electricity generation only. During the winter, natural gas is used to heat homes as well as electric generation, while in the summer, cooling is electric driven.

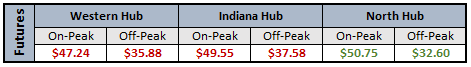
We tend not to be technical analysts, and instead follow fundamentals for pricing. That said, we have made comments in the past about the electric on peak calendar strips of PJM West, MISO IN Hub, and ERCOT North Hub. As seen below, both PJM West and IN Hub have broken what looked like pretty solid support levels. These strips have been trading below $50-$60/MW going back to mid-February, testing the $50 level a few times. As we head into summer, it appears lower summer gas prices have removed some risk premium. There's a saying in the technical analyst world, "old support is new resistance." We will continue to watch and monitor.
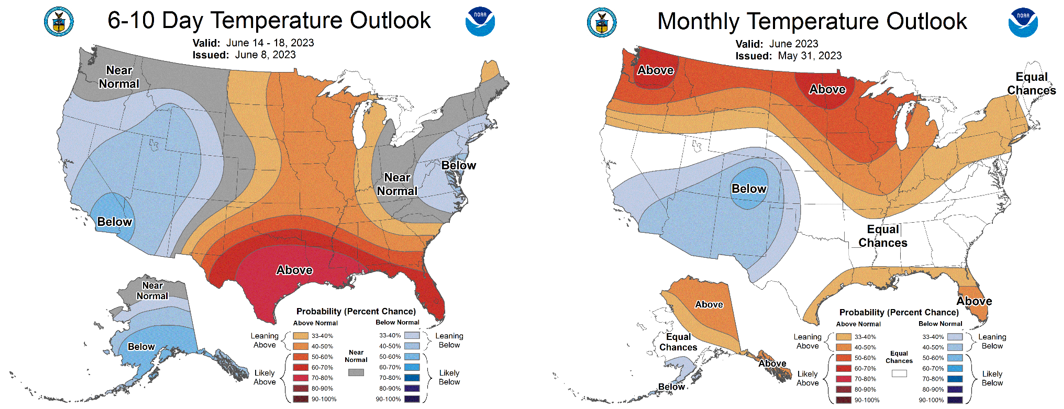
NOAA WEATHER FORCAST
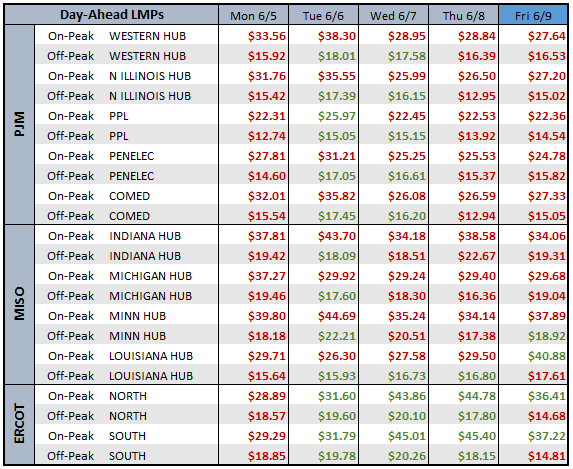
DAY-AHEAD LMP PRICING & SELECT FUTURES
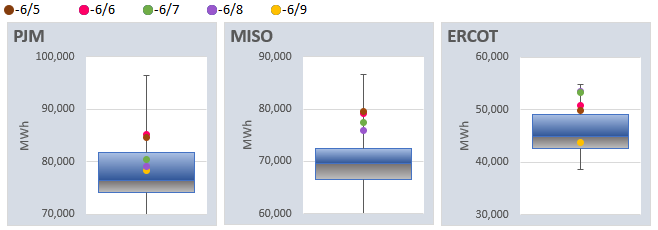
DAILY RTO LOAD PROFILES
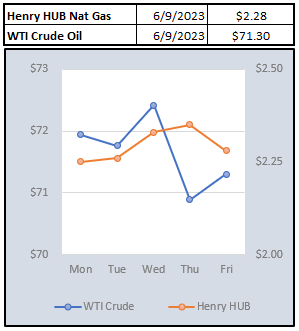
COMMODITIES PRICING
Not getting these updates delivered weekly into your inbox? Let's fix that, click the link below: