Weekly Power Outlet US - Week 33
ERCOT faced heat this week, trending below 5000 MW of reserve capacity. Wind saved ERCOT but fell to 3.5% of the stack. The energy market reflects complex interplay of supply and demand.


ERCOT Drama, Natural Gas Bull and Bear, Solar NIMBY?
Energy Market Update Week #33, brought to you by Acumen.
For More Updates Like This, Subscribe Here!
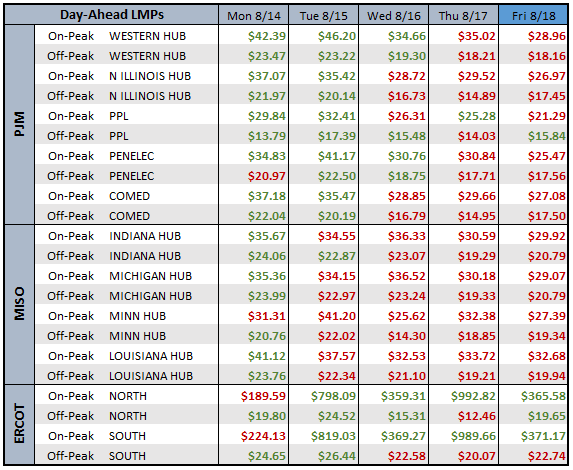
This week, ERCOT has been sweating it out and we aren't talking about just the heat. Thursday conservative actions were requested as the RTO trended to below 5000 MW of reserve capacity. Wind has certainly saved ERCOT this summer, but yesterday at one point it was only 3.5% of the stack and below 30% of its summer capacity which is roughly one fourth of nameplate capacity. The phenomenon of wind in ERCOT can be seen in the Day Ahead markets in the pricing table below. Wind typically blows hardest overnight. For instance, today's forecast calls for about 6k MW of generation at noon and around 25k MW midnight. The prices in the table are averages, and while yesterday's On Peak DA market averaged about $1000/MW in the North, the peak hour was above $3,200/MW. Conversely, the Off Peak DA market averaged $12/MW. Adding to the conservative operations drama yesterday, Real Time pricing was over $5000/MW during the afternoon.

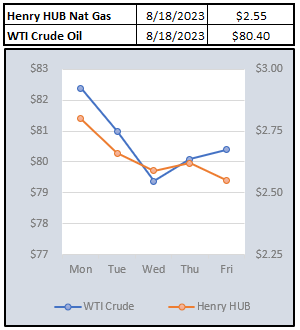
The rally in natural gas prices seems to have come and gone. The EIA reported an injection of 35 Bcf for the week ending August 11. This is in line with the 34 Bcf that was expected. Hot weather and large electricity burn can't seem to help the market hold any kind of rally. The October futures contract traded below $2.70 this morning after a recent high of around $3.20. For those scoring at home, that meets the definition of a bull and bear market all in the span of two weeks. Weather might provide some short-term volatility, but right now it seems any sustained move to the upside will come only if there is meaningful movement in the inventory numbers. Right now, we are still 21% higher than last year and 10% above the five-year average.

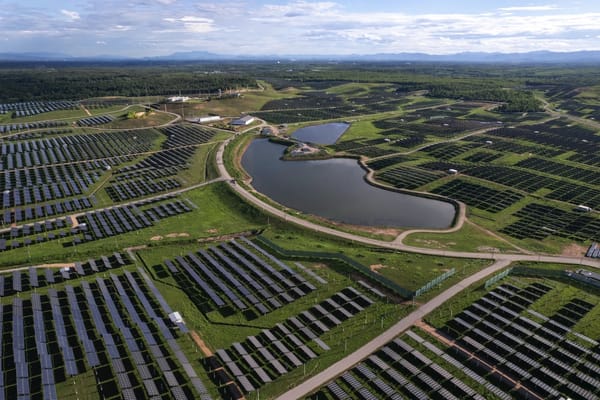
In the past we have mentioned what big fans we are of author and podcaster Robert Bryce. Mr. Bryce's podcast "Power Hungry" is a must listen covering all things energy. Recently, Mr. Bryce has identified the growing pushback on utility scale solar in communities around the country. This week alone, municipalities and communities in NY, VA, IL, and IA have voted against projects that were on the docket. In each case their seems to be differing concerns on why projects have received no votes. In VA, the issue was 466 acres of farmland being used for 80MW. The planning commission ultimately decided it wasn't in accordance with the county's provision to preserve farmland and openness. An Ilinois community decided the land required would garner 10x the taxes if used for its original intent of commercial development.
More and more there seems to be cases where the same people that are championing renewables are starting to pushback. The drama playing out in the Northeast with offshore wind is another example. Ultimately, some of these projects may get resubmitted and built, or built somewhere else. Regardless, local utilities and municipalities have may have an added hurdle in the effort to go green.
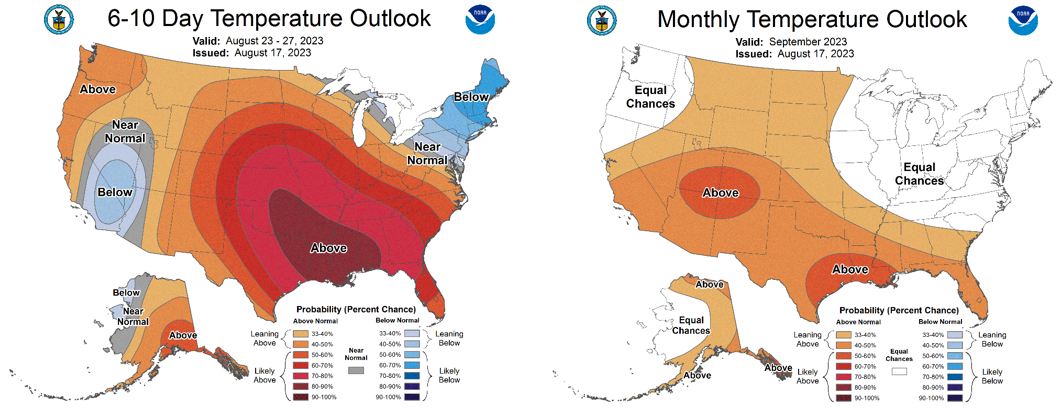
NOAA WEATHER FORECAST
DAY-AHEAD LMP PRICING & SELECT FUTURES

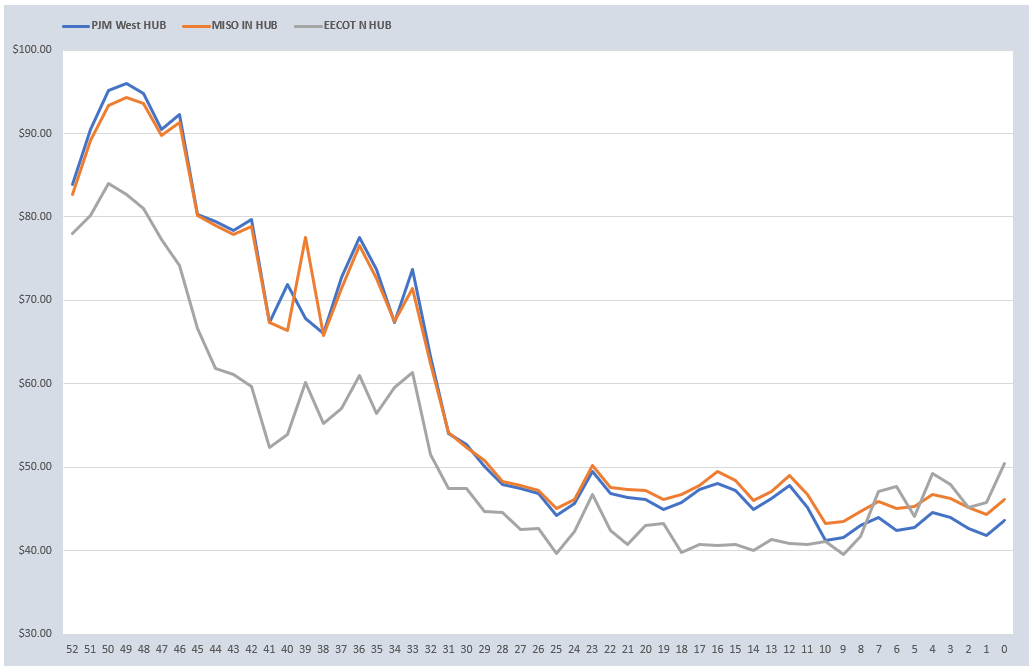
RTO AROUND THE CLOCK CALENDAR STRIP
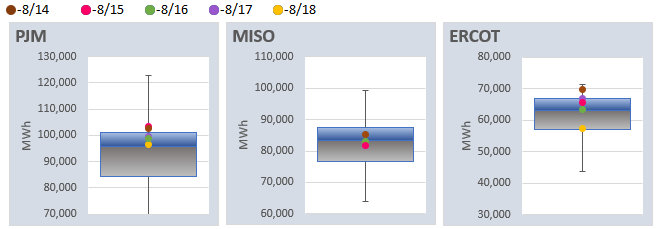
DAILY RTO LOAD PROFILES
COMMODITIES PRICING
Not getting these updates delivered weekly into your inbox? Let's fix that, click the link below: