Weekly Power Outlet US - Week 42
Natural gas volatility continues, striking upturn by inventory shock. Meanwhile, power grid challenges cast doubt on net-zero energy goals.


Natural Gas, Day-Ahead ERCOT, The Grid
Energy Market Update Week 42, brought to you by Acumen.
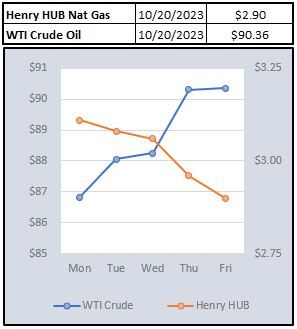
For More Updates Like This, Subscribe Here!Natural gas has done an impressive round trip that last two weeks as shown in the chart below. Some news of potential strikes and European shortfalls after some pipeline issues got the momentum going to the upside. While the LNG strikes in Australia seem to be back on again, there hasn't been much follow through out of Europe.
Yesterday's EIA data seemed to be a final blow as injection of 97 Bcf for the week ending October 13, was well above the 83 Bcf expected. Inventories continue to be roughly 10% above last year's level and about 5% higher than the 5-year average.
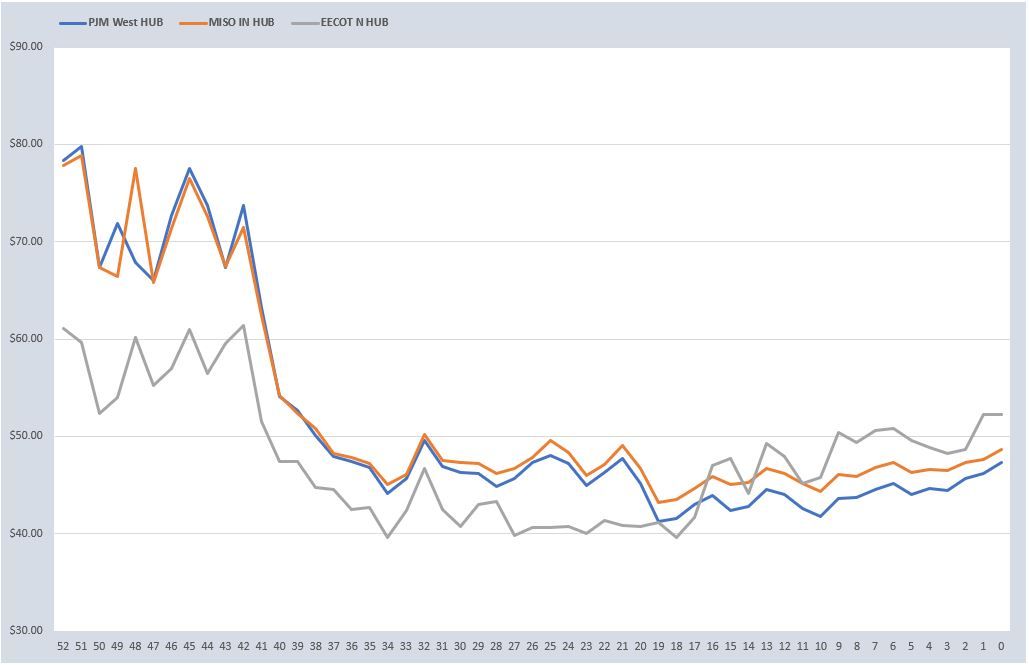
12-month strip electricity prices have held pretty steady as most of the movement in the gas curve has been in the front and winter. If we see continued weakness, expect electricity prices to start to back up.

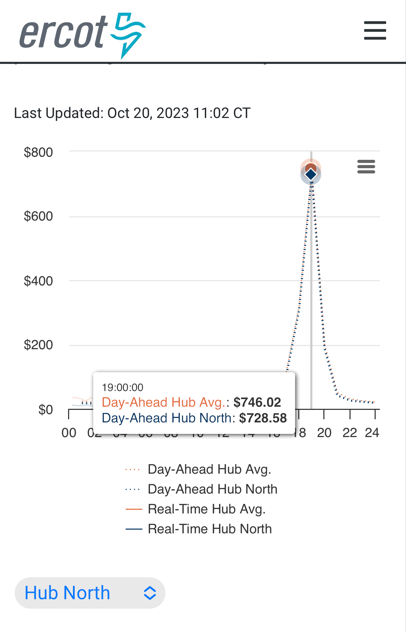
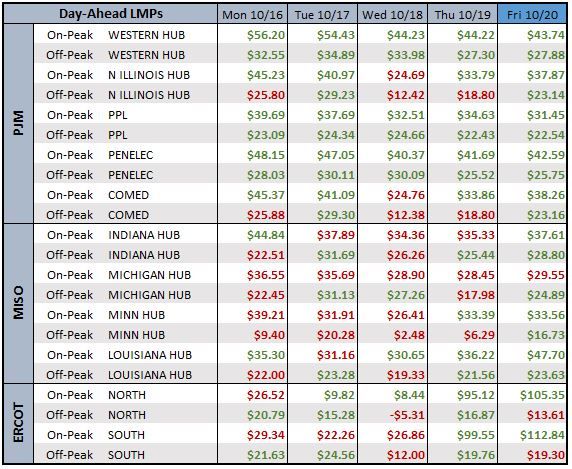
Part of our weekly data below is the day ahead pricing for certain hubs with RTOs. One that caught our eye this week was ERCOT. Looking at the daily pricing, you'll notice that on peak pricing went from single digits mid-week to trading over $100 for Friday. The snapshot taken from ERCOT's pricing app shows exactly how this happens as prices cleared around $750 in the evening. We see this in the summer a fair amount on heavy demand days.
While today's temps in Texas are warm, they aren't nearly the triple digit humidity laced numbers from the summer. This is something ERCOT is dealing with in the fall as the sun sets earlier and wind hasn't ramped up from lower levels.

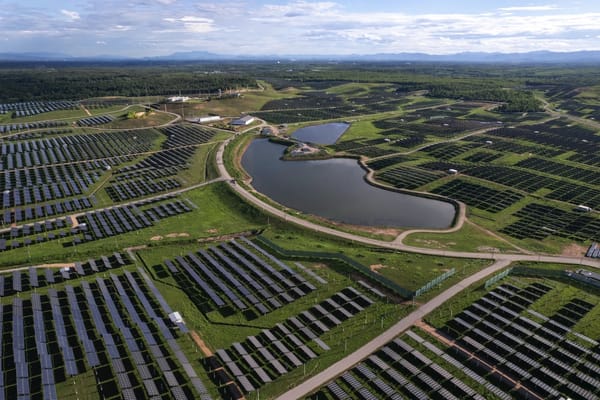
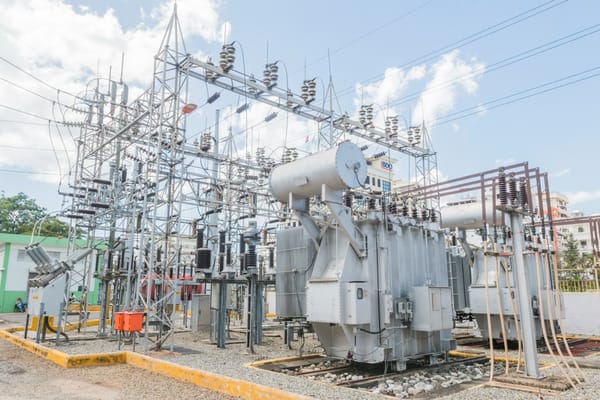
Transmission, and the grid, has been one of the key factors into why we think some of the net zero talk and GHG goals are optimistic.
We tend to read the International Energy Agency reports and papers with a hint of skepticism as they tend to, using Wall St lingo, talk their book. That said, we found this report to be of great interest.
According to this report, to achieve energy & climate goals, the world needs to add or replace 80 million kilometers of power lines by 2040. That’s the size of the entire global grid built over the past 100 years and enough to wrap around the Earth roughly 2,000 times.
This doesn't even take into account the dollars needed. Some estimates are upwards of $40-50 trillion to get the grid to a point where it could make net zero a reality. In the current environment, it's hard to picture an appetite for that level of spending around the world.
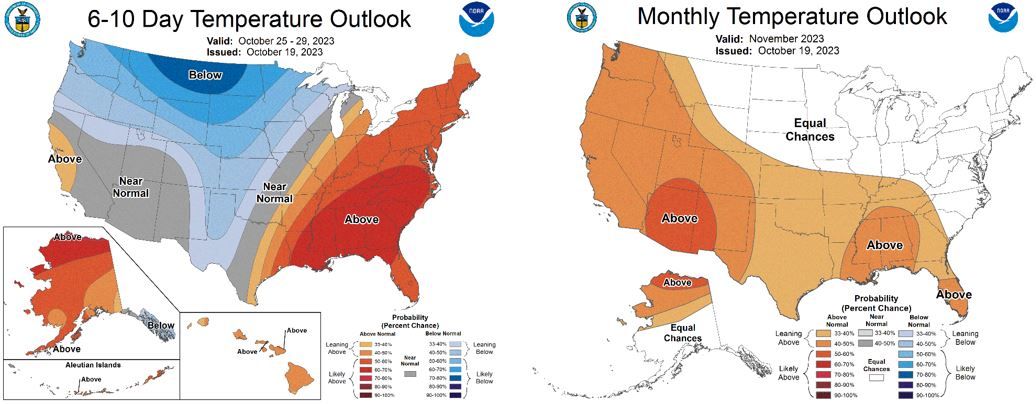
NOAA WEATHER FORECAST
DAY-AHEAD LMP PRICING & SELECT FUTURES

RTO AROUND THE CLOCK CALENDAR STRIP
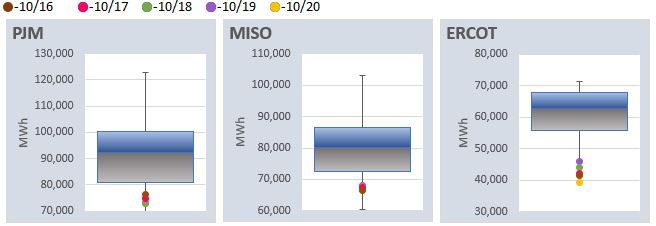
DAILY RTO LOAD PROFILES
COMMODITIES PRICING
Not getting these updates delivered weekly into your inbox? Let's fix that, click the link below: