Weekly Power Outlet US - Week 49
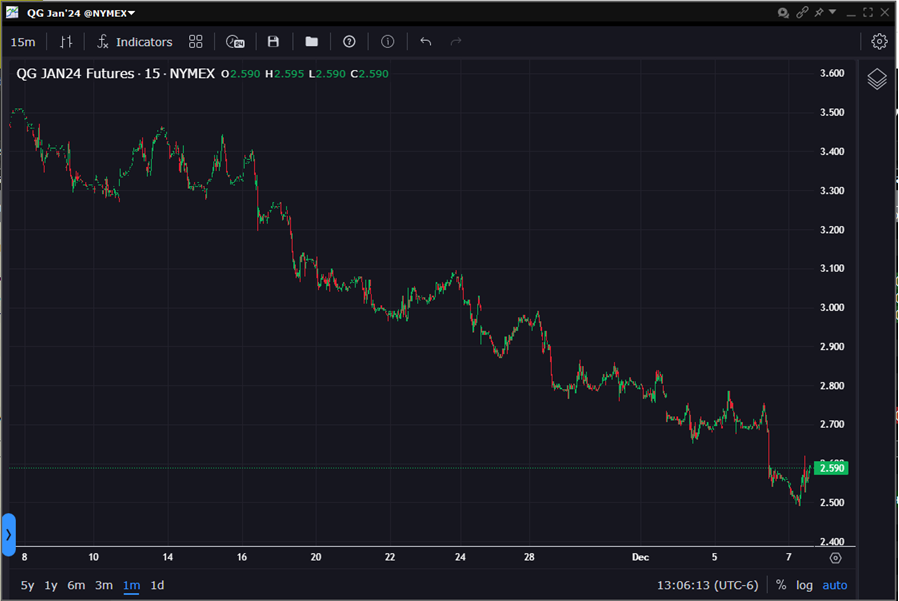
NYMEX Henry Hub prices plummet to $2.50 from $3.60 in a month. Unseasonably mild temperatures and production add to the downward trend, challenging even the most optimistic market observers.


Winter?, Natural Gas Skiing, Electricity Prices
Energy Market Update Week 49, brought to you by Acumen.
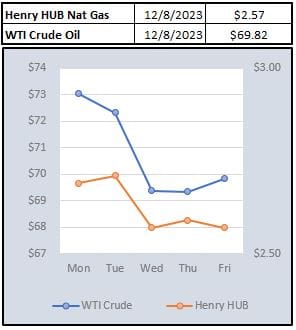
For More Updates Like This, Subscribe Here!The January contract on NYMEX Henry Hub natural gas touched $2.50 this week after holding at $3.60 a month ago. The chart below shows a one-month ride (Thursday close) that would give even the best double black diamond skier pause.
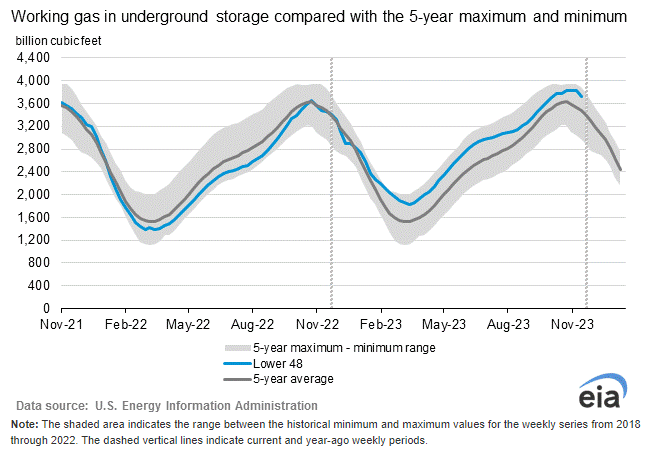
Thursday's EIA storage numbers printed a withdrawal of 117 Bcf which was more than expected. As shown below, stocks were 254 Bcf higher than last year at this time and 234 Bcf above the five-year average of 3,485 Bcf. At this point, even lighter storage numbers aren't offsetting the production numbers and weather readings in the US as mild temperatures have persisted.
Just in case the gas bears needed more, earlier this week Exxon announced that their Golden Pass LNG terminal under construction in Texas, will have its online date pushed from late 2024 to early 2025. While this doesn't seem like it should be that much of a market drive for the front months, it has given the bears another data point to flash all over the airwaves.

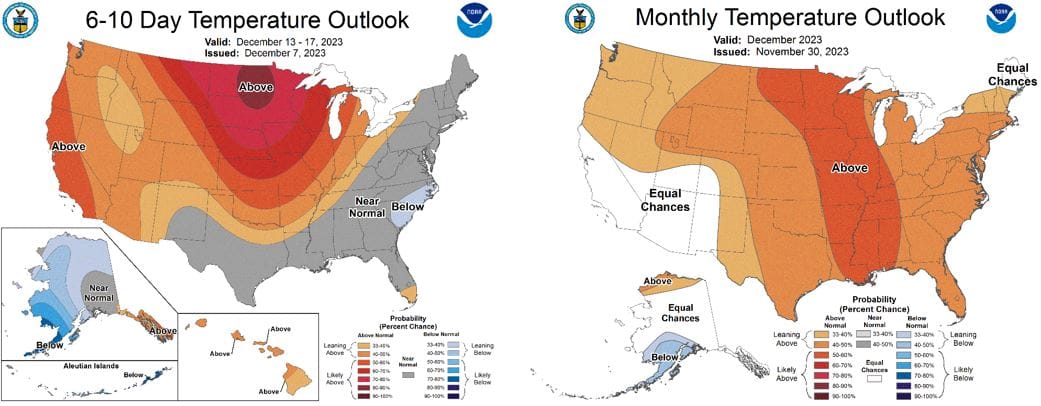
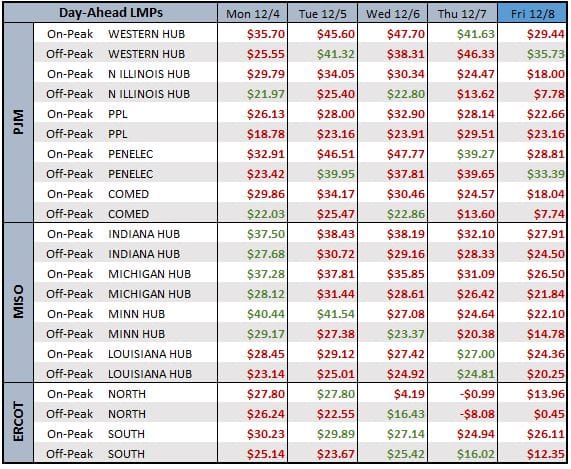
The calendar says sleigh rides and cross-country skiing here in Minnesota, but the above picture is reality. The weather maps below aren't showing any near-term cold temps that would be driving electricity demand this time of year. The day ahead prices below showed week over week prices even lower than what has already been pretty seasonally low levels.
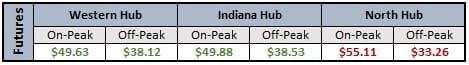
Looking at strip pricing, it appears PJM and MISO have reached a point where even lower natural gas prices can't push electricity lower. We tend to look at the $50 on peak level and pretty concrete, and that appears to be holding. ERCOT did have a pretty impressive leg down and the three strips we follow are pretty close to the same price which hasn't been the case in the last year.
NOAA WEATHER FORECAST
DAY-AHEAD LMP PRICING & SELECT FUTURES
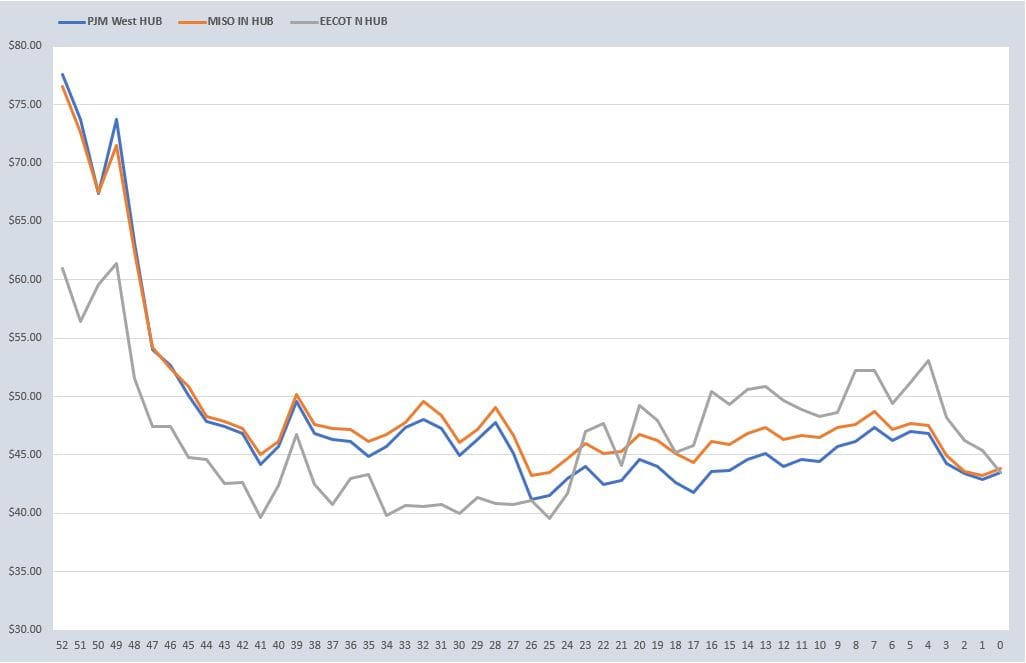
RTO AROUND THE CLOCK CALENDAR STRIP
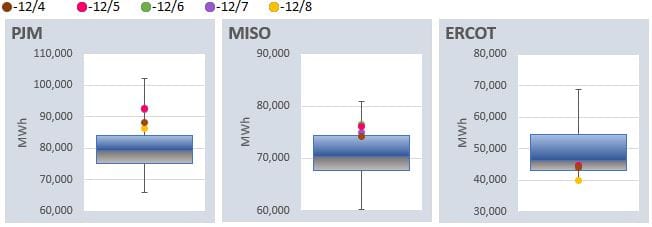
DAILY RTO LOAD PROFILES
COMMODITIES PRICING
Not getting these updates delivered weekly into your inbox? Let's fix that, click the link below: