Weekly Power Outlet US - Week 50
Weekly Power Outlet Update- Given the movements in electricity futures and trying to paint the full picture, On/Off peak charts have now been added to RTC.


Load Growth, Oil Production, Holiday Lights!
Energy Market Update Week 50, brought to you by Acumen.
For More Updates Like This, Subscribe Here!
Each year FERC collects information through Form 714 (Form 714) from electric utilities, balancing authorities, and planning areas in the United States to help with forecasting and planning with regard to load demand. This week Utility Dive highlighted a comprehensive report from Grid Strategies. using the data from Form 714. According to the report, which is must read work, the rate of load growth in the US is expected to increase 4.7% over the next five years. This is an increase from a predicted growth rate of just 2.6% last year. The increase is specifically being driven by data centers. We've commented recently on how the conversation has moved fairly quickly from concerns about EVs to data centers. The chart below shows expected load growth coming from data centers for all geographic regions with the exception of CAISO.
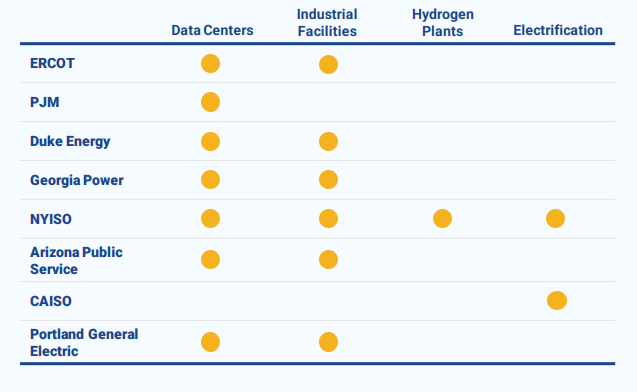
Data centers has been synonymous with crypto mining over the last couple years. With each passing day, more and more comments from companies include AI and how it will drive their businesses. Given the electricity required for AI to search training sets that are going to get bigger and bigger, it's possible the conclusions in this report might be light.

The Thursday weekly EIA natural gas storage report showed a withdrawal of 55 Bcf which was in line with estimates. The report was a yawner for the natural gas market which continues to be in a supply glut.
This week IEA announced that OPEC+ will be only 51% of the oil production in the world for 2023. A good chunk of that lower number is the US production which broke 20 million barrels per day in September. Right now, the US is on track to increase production by 1.4 million barrels per day for the year. While oil isn't typically thought of as a correlated to electricity, natural gas is a biproduct of oil production. As mild weather has limited load demand for heating so far this winter, natural gas continues to be in a simple economic model of supply outpacing demand. Until those dynamics change, expect electric futures prices to be muted.

One of the earliest supporters of the WPO was a guy we will call Pat, for the sake of this writing. To be fair, this guy was more than a supporter, he's the original guy that said something along the lines of, 'you guys should put some thoughts down on paper each week', and thus the WPO was born. With that, when Pat suggests something for the WPO, we listen-sometimes. The latest suggestion/question was interesting, " you guys know how much electricity is used for Christmas decorations?".
After putting some pencil to the back of an envelop, it was quickly realized there are way too many assumptions to make....are we using LED lights, incandescent, are we considering the Griswold house or just a few strings of lights.
Doing some digging, we've discovered someone has already undertaken this festive exercise. Apparently, researchers Todd Moss and Pricilla Agyapong have already done the study, although with dated data for 2023. Using 2008 data collected from a Department of Energy and the World Bank, they surmised that the US uses roughly 6.63 billion kWh of electricity every year (again, 2008 data) to fix lights to the house and wrap trees. A summary appeared in an article from a science website called phsy.org, where the point was made that the Christmas decoration load for the US is more than the national consumption of some developing countries like Ethiopia and Tanzania. While that may, or may not, be fact any longer, 6.6 billion kWh is an impressive number. Just for context, if that load was spread throughout the year, we'd need a plant with capacity of 750 MW to handle it our festive lights. Happy Holidays indeed!
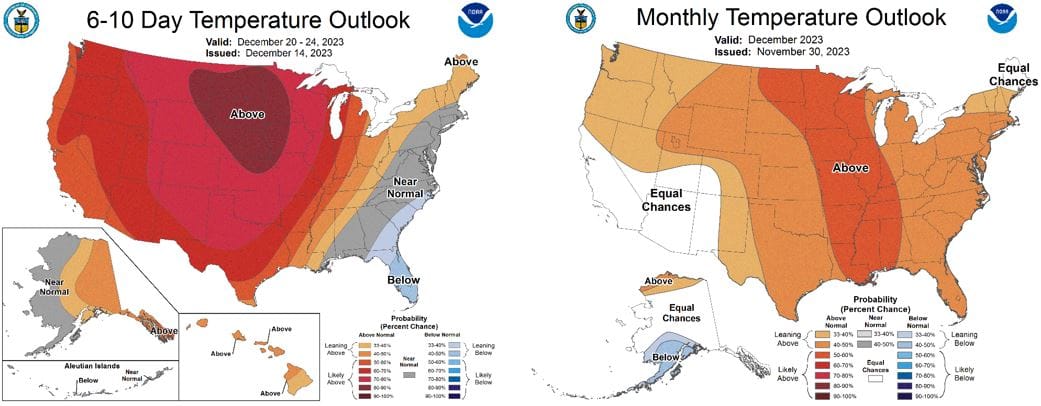
NOAA WEATHER FORECAST
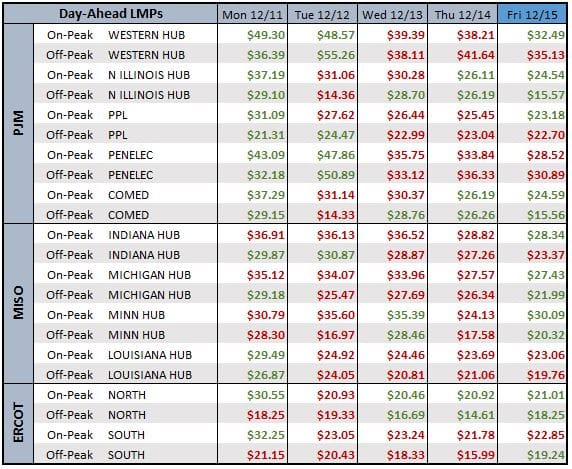
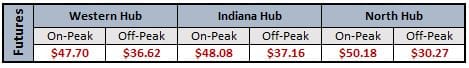
DAY-AHEAD LMP PRICING & SELECT FUTURES
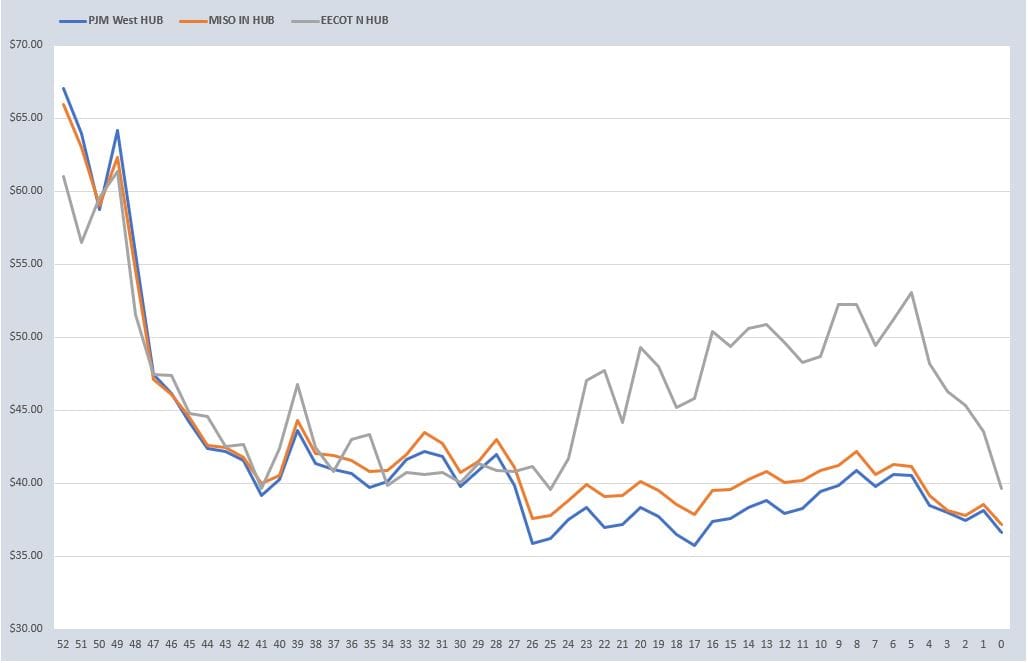
RTO AROUND THE CLOCK CALENDAR STRIP
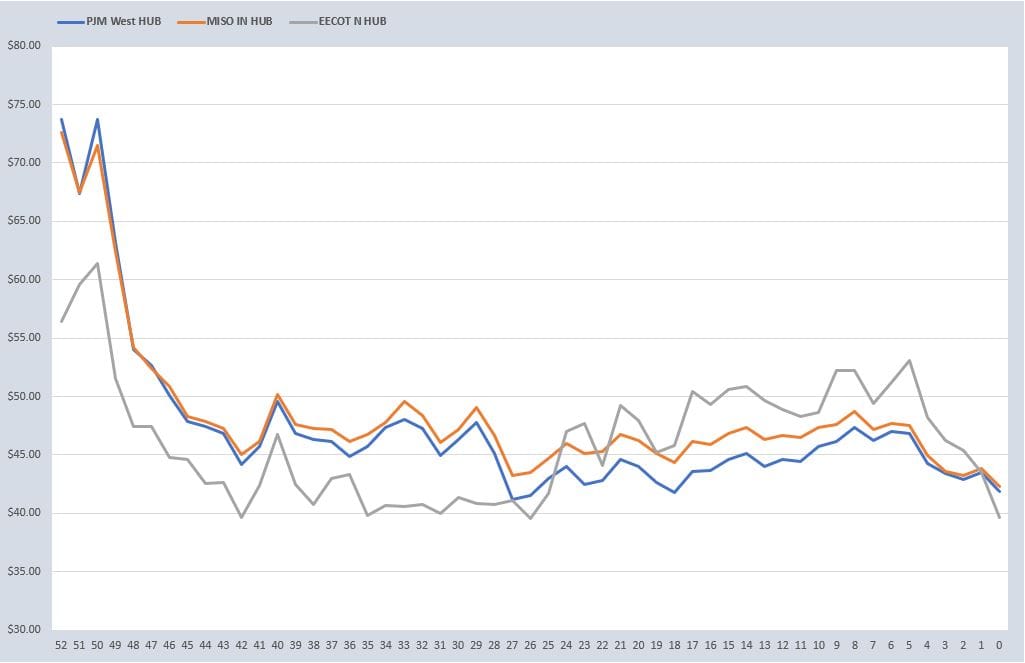
RTO ON PEAK CALENDAR STRIP
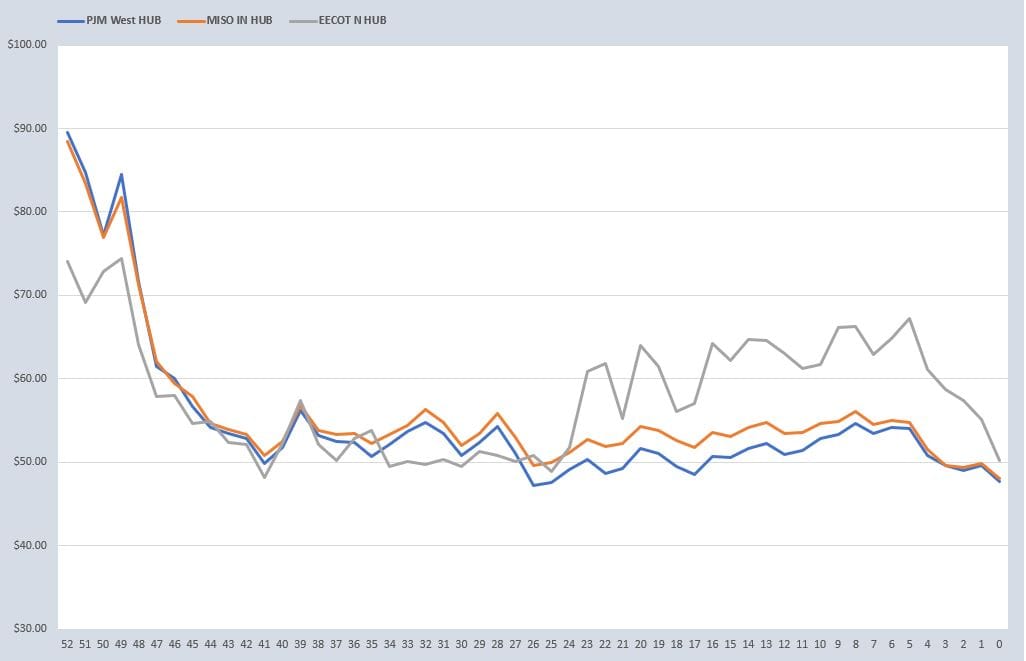
RTO OFF PEAK CALENDAR STRIP
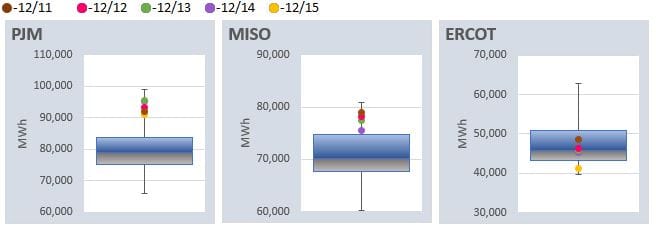
DAILY RTO LOAD PROFILES
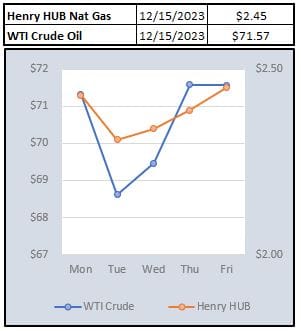
COMMODITIES PRICING
Not getting these updates delivered weekly into your inbox? Let's fix that, click the link below: